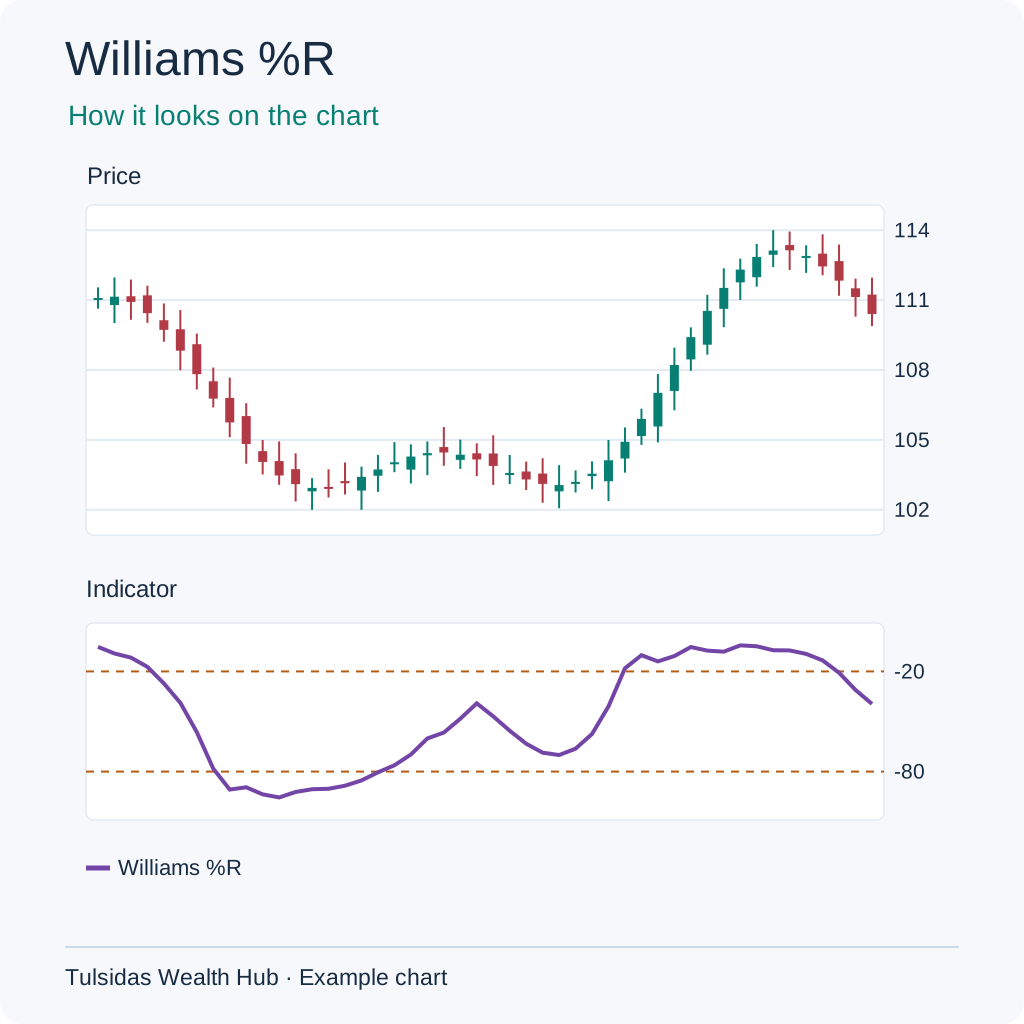
RSI (Relative Strength Index)
Your shop’s sales sometimes rise and sometimes fall. If the average rise is ₹30 and the average fall is ₹10, the rise is three times as large. The same ratio in a share’s closing-price changes gives RSI 75. Above 70 is called overbought and below 30 is called oversold. Price can keep moving in the same direction beyond either line.
How to read it Measures recent gains relative to losses on a 0–100 scale. RSI 75 shows strong recent upside momentum. It can stay above 70 through a strong rally.
How to add it to the chart In ƒx / Indicators, search for RSI and select it. Example setting — 14 bars · 30 / 70.
See how the chart looks after adding the indicator.
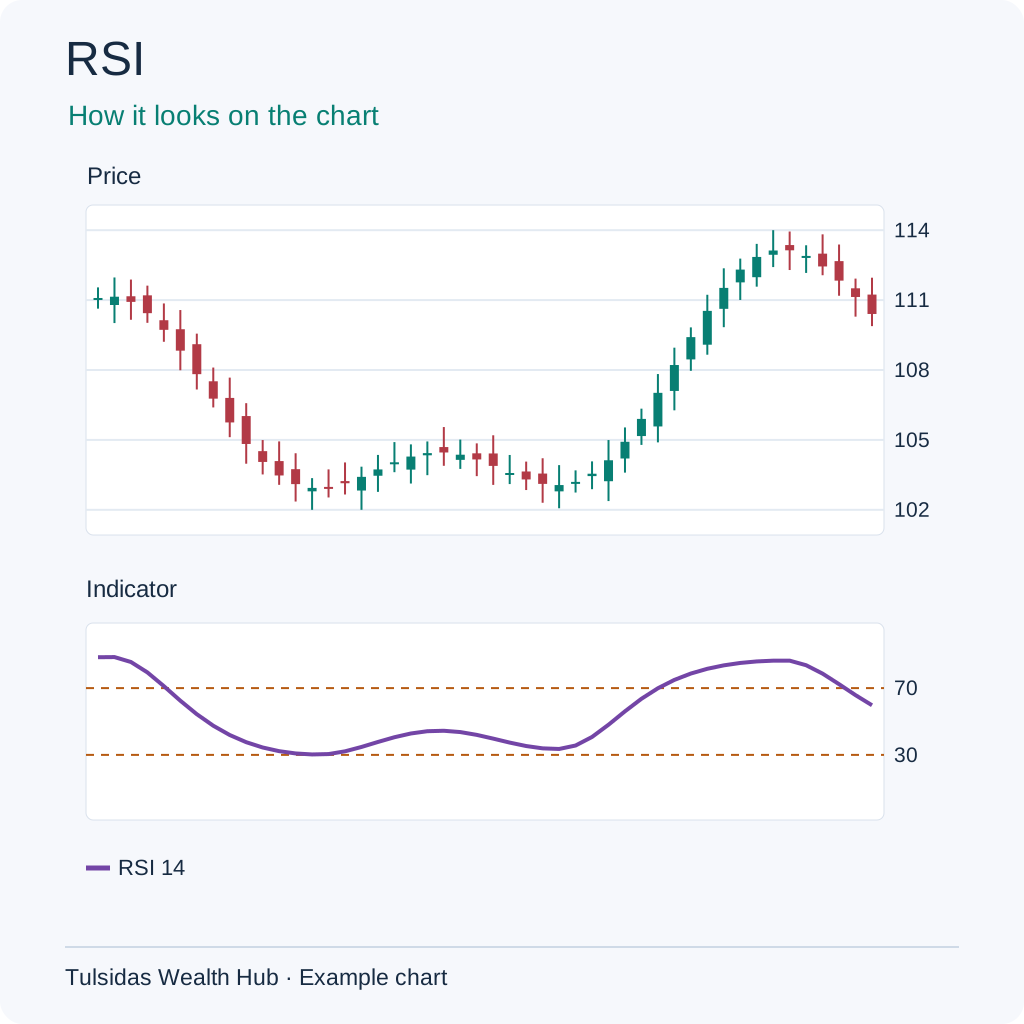
MACD (Moving Average Convergence Divergence)
Say your shop averaged ₹1,000 a day last month and ₹1,200 recently. The gap is ₹200. If it narrows to ₹100, the recent average is still higher, but the two averages are closer. On a chart, MACD subtracts the 26-bar EMA from the 12-bar EMA. ₹105 − ₹102 gives +3. The signal line smooths MACD, and the little histogram bars show the gap between those two lines.
How to read it The MACD line is the difference between two EMAs. The signal line smooths that difference. MACD +1.2 versus signal +0.8 gives a +0.4 histogram. Range-bound prices can produce repeated crosses.
How to add it to the chart In ƒx / Indicators, search for MACD and select it. Example setting — 12 / 26 / 9.
See how the chart looks after adding the indicator.
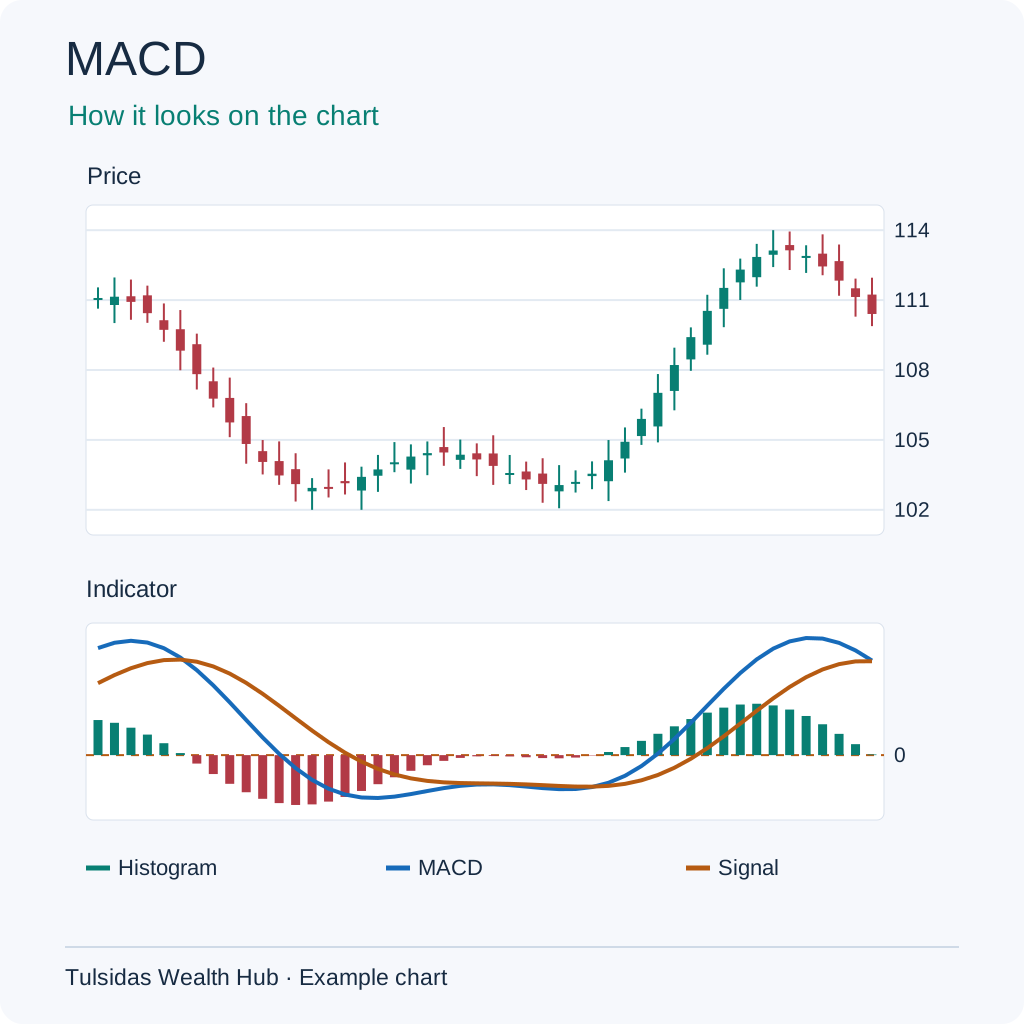
Stochastic (Stochastic Oscillator)
An item traded between ₹100 and ₹110 and closes at ₹108. That is 80% of the way up from the bottom. Stochastic shows where the close sits in its recent range. %K is the main line, and %D smooths it.
How to read it Locates the close within a recent high–low range. A close of 108 in a range of 100–110 gives raw %K of 80 before smoothing. Strong trends can keep it near an extreme.
How to add it to the chart In ƒx / Indicators, search for Stochastic and select it. Example setting — 14 / 3 / 3 · 20 / 80.
See how the chart looks after adding the indicator.
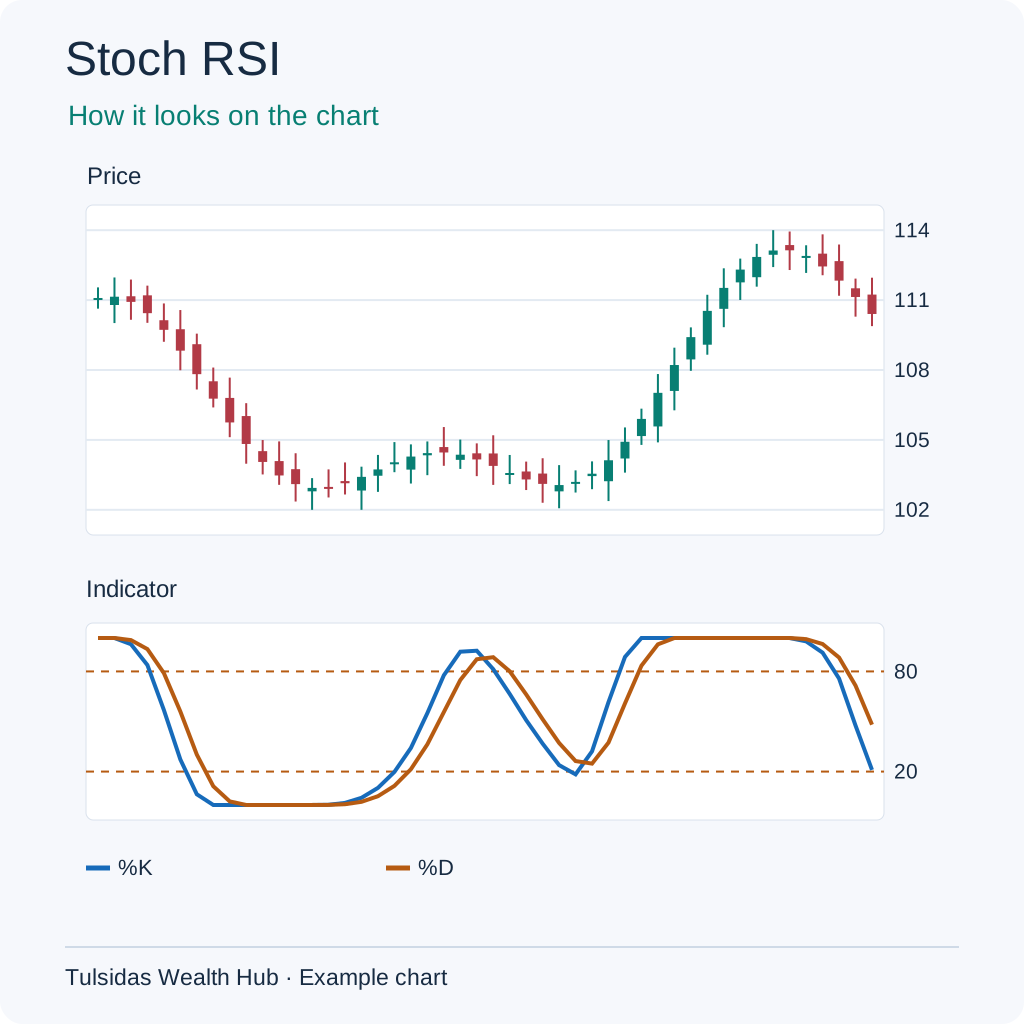
Stoch RSI (Stochastic Relative Strength Index)
Your practice-test scores ranged from 40 to 60 and today you scored 58. You are near the top of your own recent range. Stoch RSI does that with RSI itself. The raw reading is (58 − 40) ÷ (60 − 40) = 0.9, or 90%.
How to read it Applies the stochastic calculation to RSI itself. A raw reading near 0.9 means RSI is near the top of its own recent range. Its sensitivity can produce frequent signals.
How to add it to the chart In ƒx / Indicators, search for Stochastic RSI and select it. Example setting — 14 / 14 / 3 / 3 · 0.2 / 0.8.
See how the chart looks after adding the indicator.
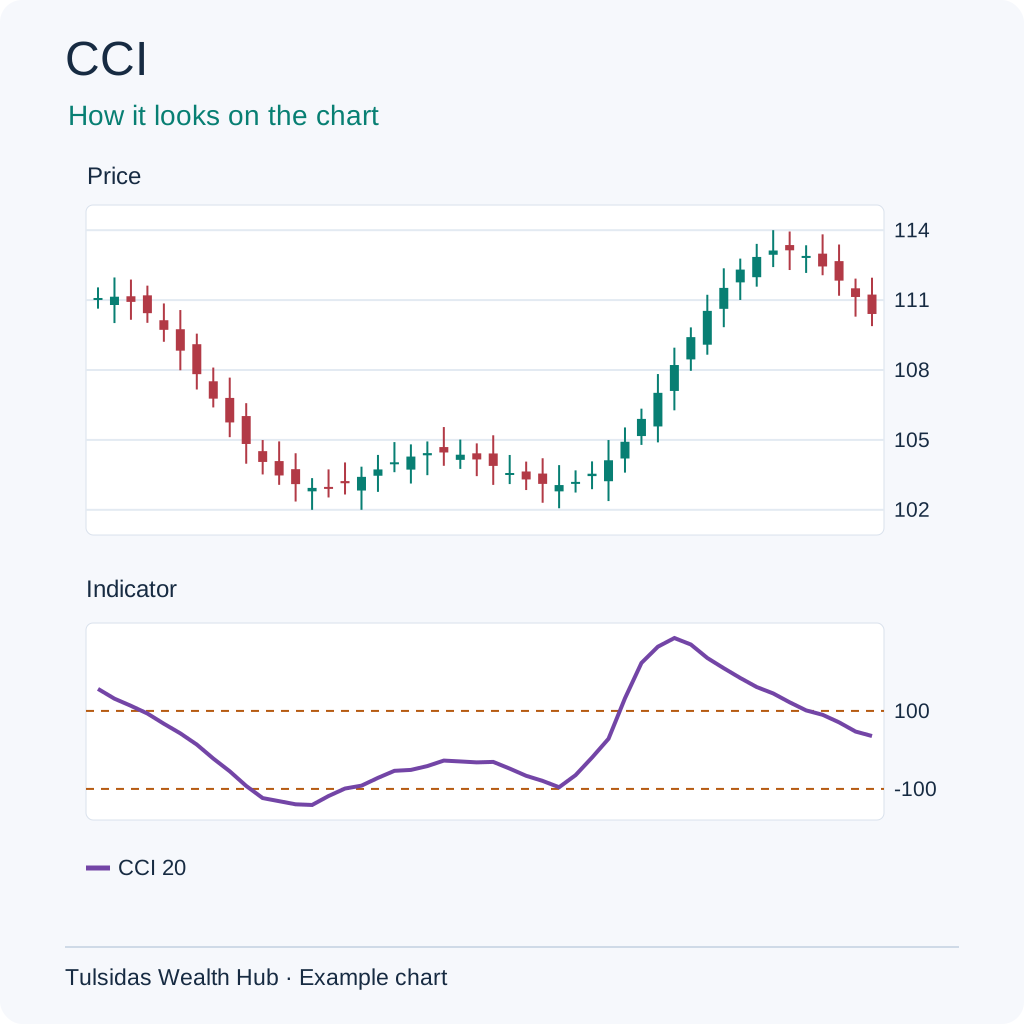
CCI (Commodity Channel Index)
If your shop usually sells around ₹1,000 a day and varies by about ₹50, a ₹1,300 day stands out. CCI compares the typical price with its average and asks how unusual the gap is compared with normal variation.
How to read it Measures how far typical price is from its moving average relative to usual deviation. +120 shows a strong positive deviation. It can remain outside the reference band.
How to add it to the chart In ƒx / Indicators, search for CCI and select it. Example setting — 20 bars · −100 / +100.
See how the chart looks after adding the indicator.
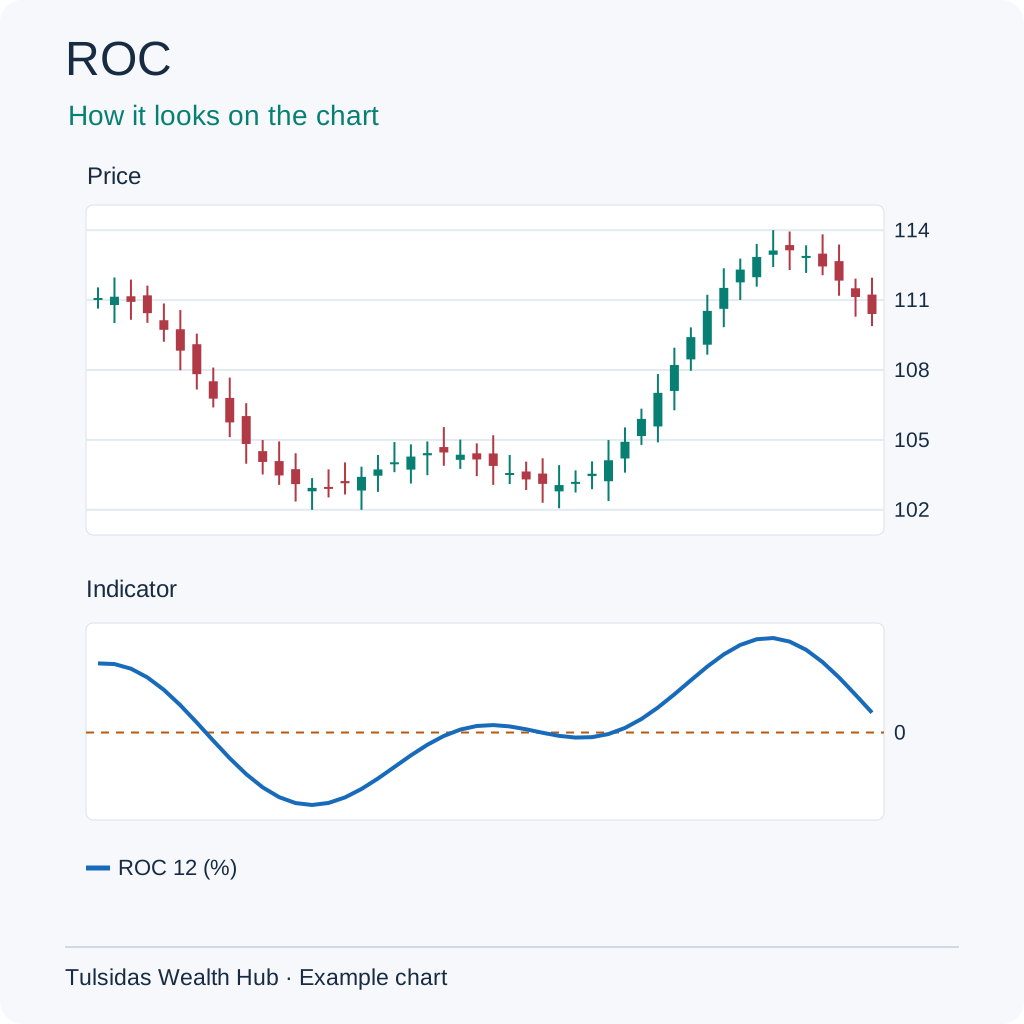
ROC (Rate of Change)
Your shop sold ₹1,000 ten days ago and ₹1,100 today. The increase is ₹100 ÷ ₹1,000 = 10%. ROC compares today’s close with the close a chosen number of bars earlier in the same way.
How to read it Measures percentage change versus N bars ago. Price 110 versus 100 twelve bars ago gives +10%. The comparison changes as old bars roll out.
How to add it to the chart In ƒx / Indicators, search for ROC and select it. Example setting — 12 bars.
See how the chart looks after adding the indicator.
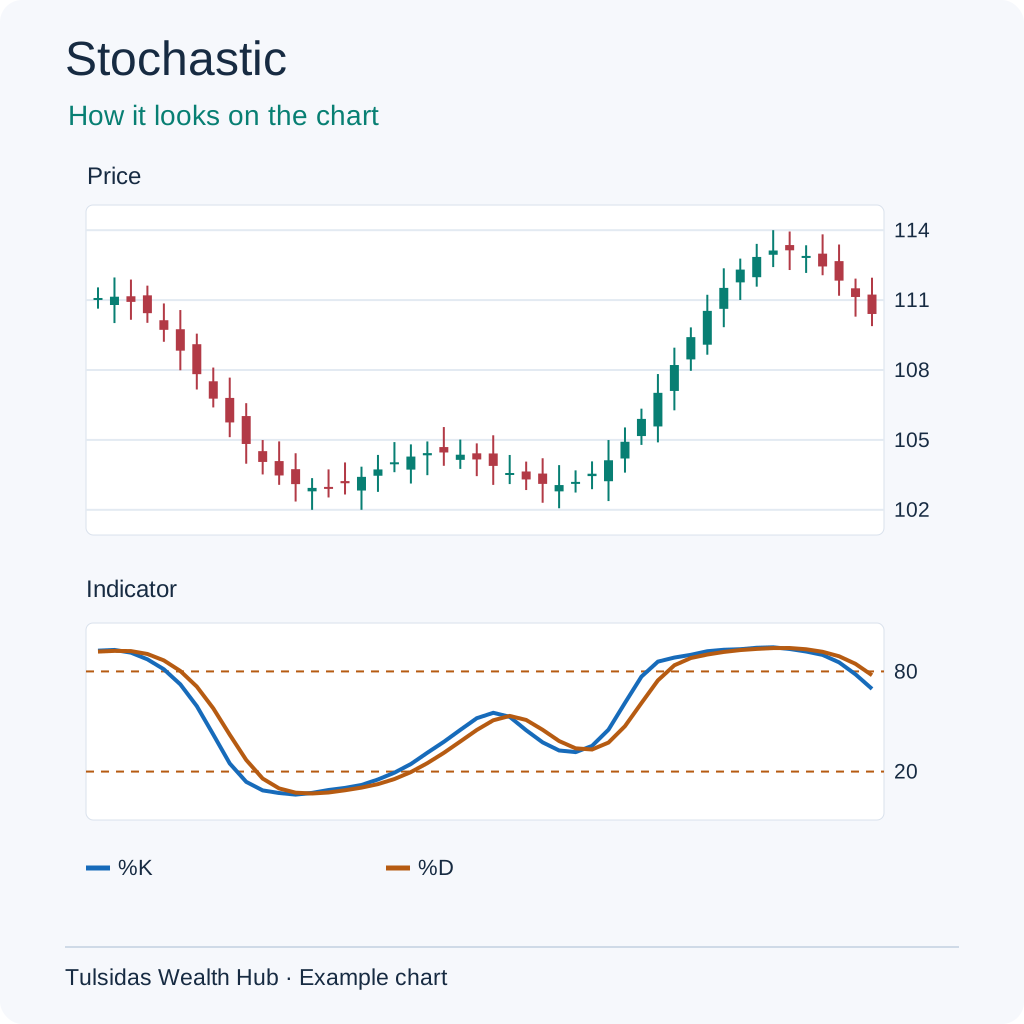
Williams %R (Williams Percent Range)
An item in a ₹100–₹110 range closes at ₹108. It is ₹2 below the top of a ₹10 range, giving −20. A reading near 0 is near the top. A reading near −100 is near the bottom.
How to read it Locates the close in its high–low range on a −100 to 0 scale. A close of 108 in a 100–110 range gives −20. An extreme reading can persist.
How to add it to the chart In ƒx / Indicators, search for Williams %R and select it. Example setting — 14 bars · −80 / −20.
See how the chart looks after adding the indicator.