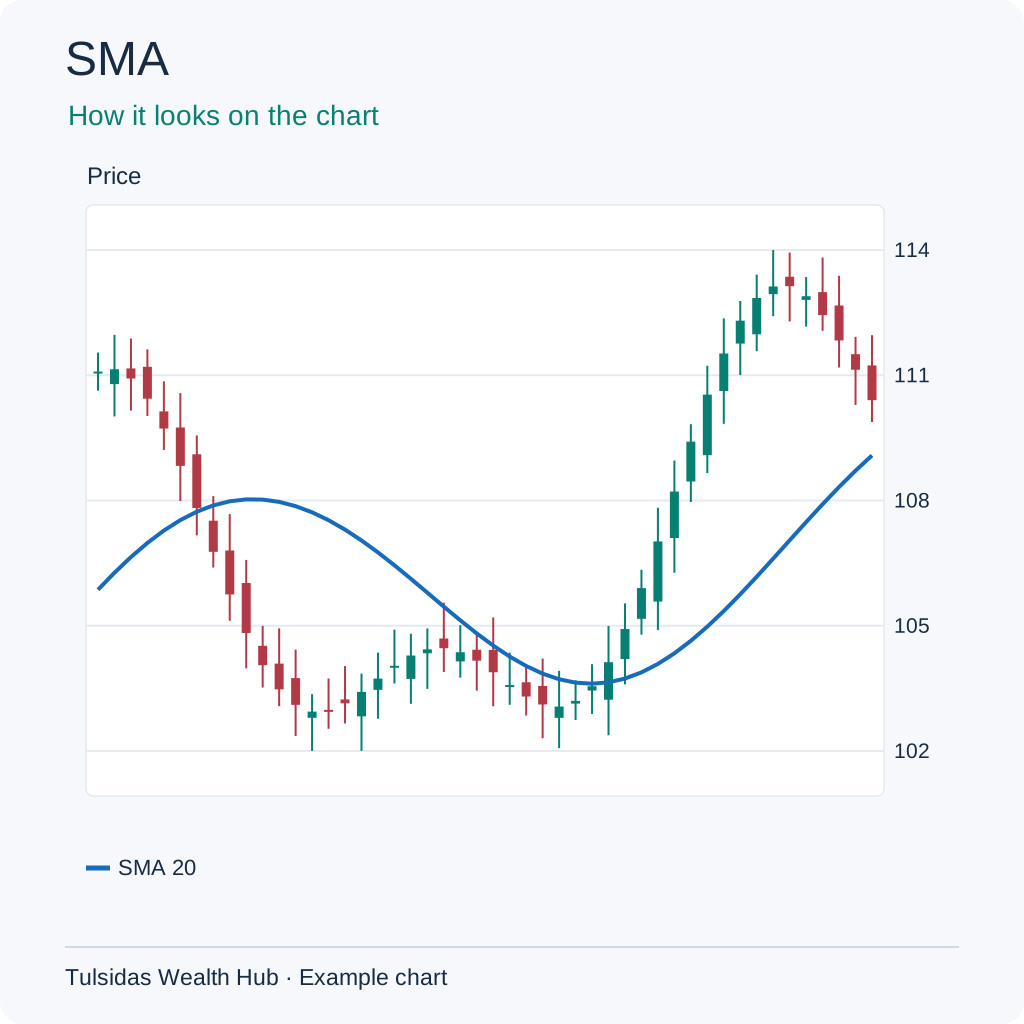
SMA (Simple Moving Average)
Say your new shop sells ₹100 on day one, ₹200 on day two and ₹50 on day three. If the total for ten days is ₹1,500, the daily average is ₹1,500 ÷ 10 = ₹150. A daily stock chart does the same with closing prices. Choose 10 for the last 10 sessions, 20 for the last 20, or 30 for the last 30. You can also choose 50, 100 or 200. The chart does the maths and draws the line.
How to read it Averages the last N closes equally. Price at 105 against SMA 100 is above its recent average. A slow SMA can lag a turn.
How to add it to the chart In ƒx / Indicators, search for SMA and select it. Example setting — Length 10 / 20 / 30 / 50 / 100 / 200.
See how the chart looks after adding the indicator.
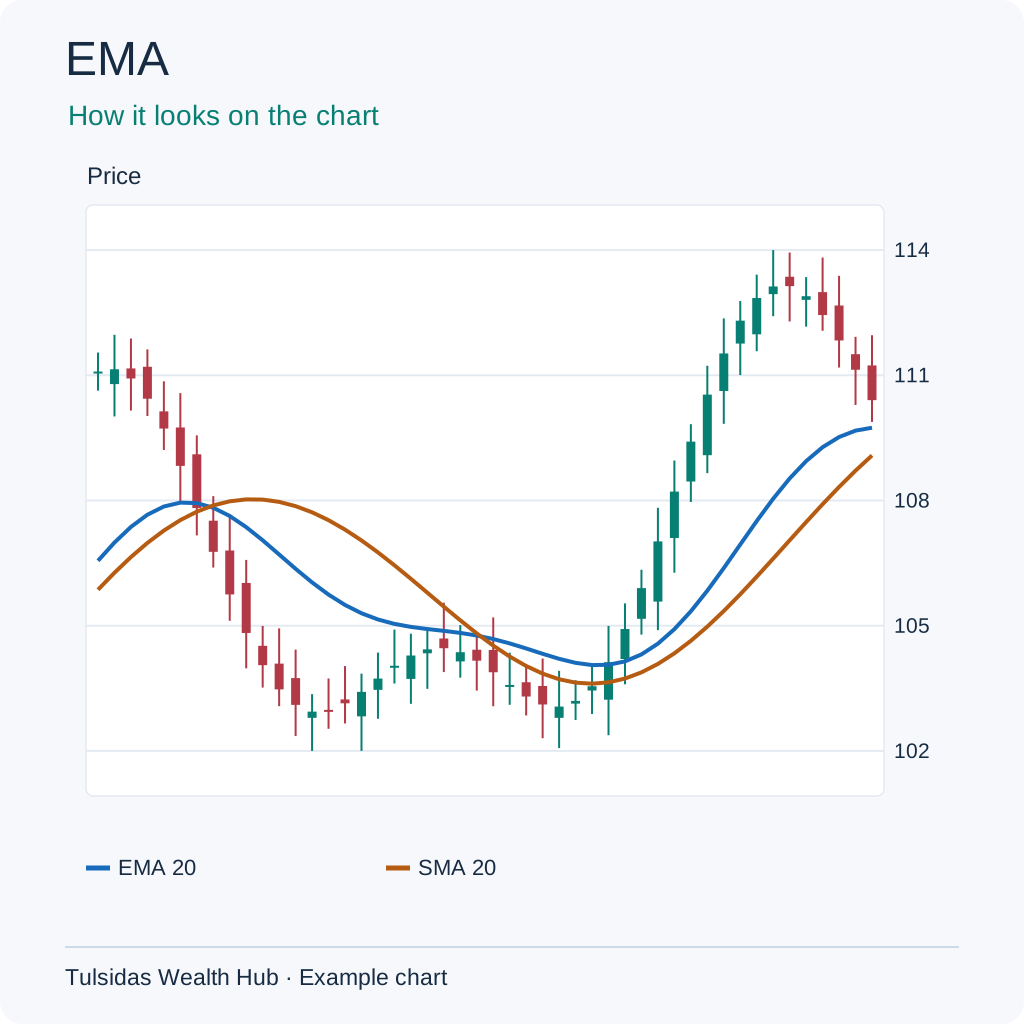
EMA (Exponential Moving Average)
To guess how busy your shop might be tomorrow, you might give more importance to the last two days than to earlier days. EMA does this with prices. If a share stayed around ₹100 and closes at ₹110 today, an EMA will generally move towards the new price faster than an SMA of the same length.
How to read it Weights recent prices more heavily. An EMA rising from 100 to 102 shows a rising weighted average. Choppy prices can cause repeated crosses.
How to add it to the chart In ƒx / Indicators, search for EMA and select it. Example setting — Length 20 or 50.
See how the chart looks after adding the indicator.
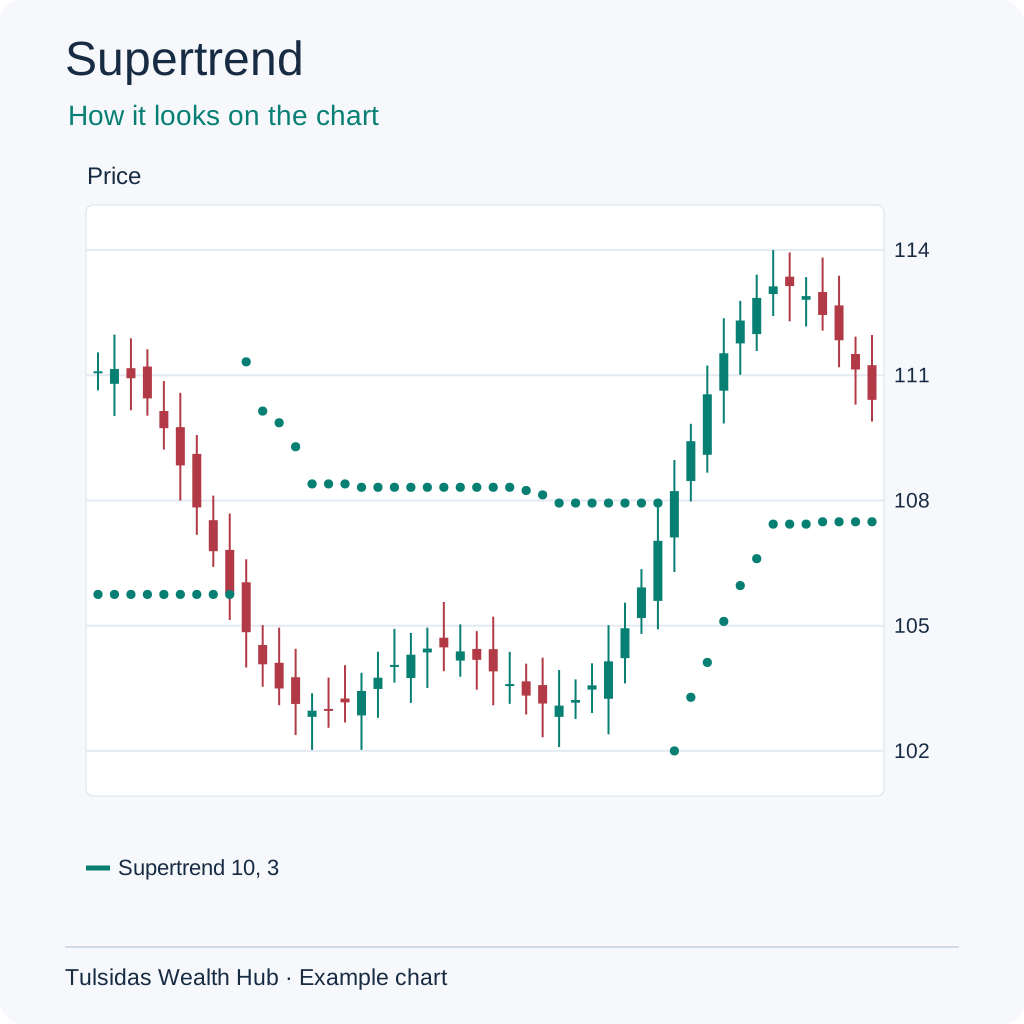
Supertrend
On a bumpy road you might leave more space in front of your car. Supertrend also makes room for bigger price swings. If ATR is ₹2 and the multiplier is 3, the calculation uses ₹6 to build its bands. The line below price shows its upward state and above price shows its downward state. In a sideways market it may switch repeatedly.
How to read it Uses ATR to place a line above or below price. A flip from above the candles to below shows a shift in the indicator’s trend state. Sideways markets can produce frequent flips.
How to add it to the chart In ƒx / Indicators, search for Supertrend and select it. Example setting — ATR 10 × 3.
See how the chart looks after adding the indicator.
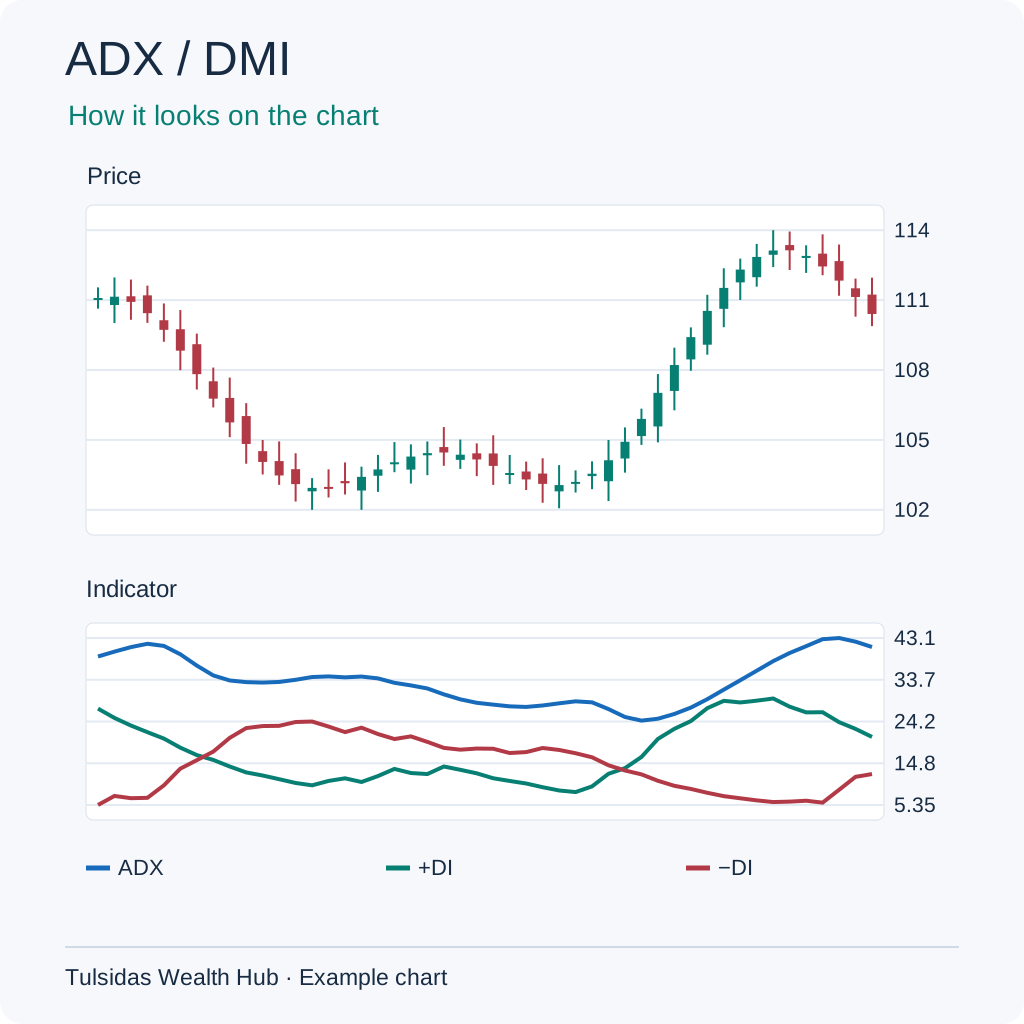
ADX (Average Directional Index) / DMI (Directional Movement Index)
On a bike, direction and effort are different things. +DI and −DI help show direction by looking at moves in highs and lows. ADX shows how strong the trend is. A rising ADX with −DI above +DI can accompany falling prices.
How to read it ADX gauges trend strength. +DI and −DI indicate direction. ADX 30 with −DI above +DI can describe a strong downward move. ADX responds with a lag.
How to add it to the chart In ƒx / Indicators, search for DMI or Directional Movement and select it. Example setting — 14 bars.
See how the chart looks after adding the indicator.
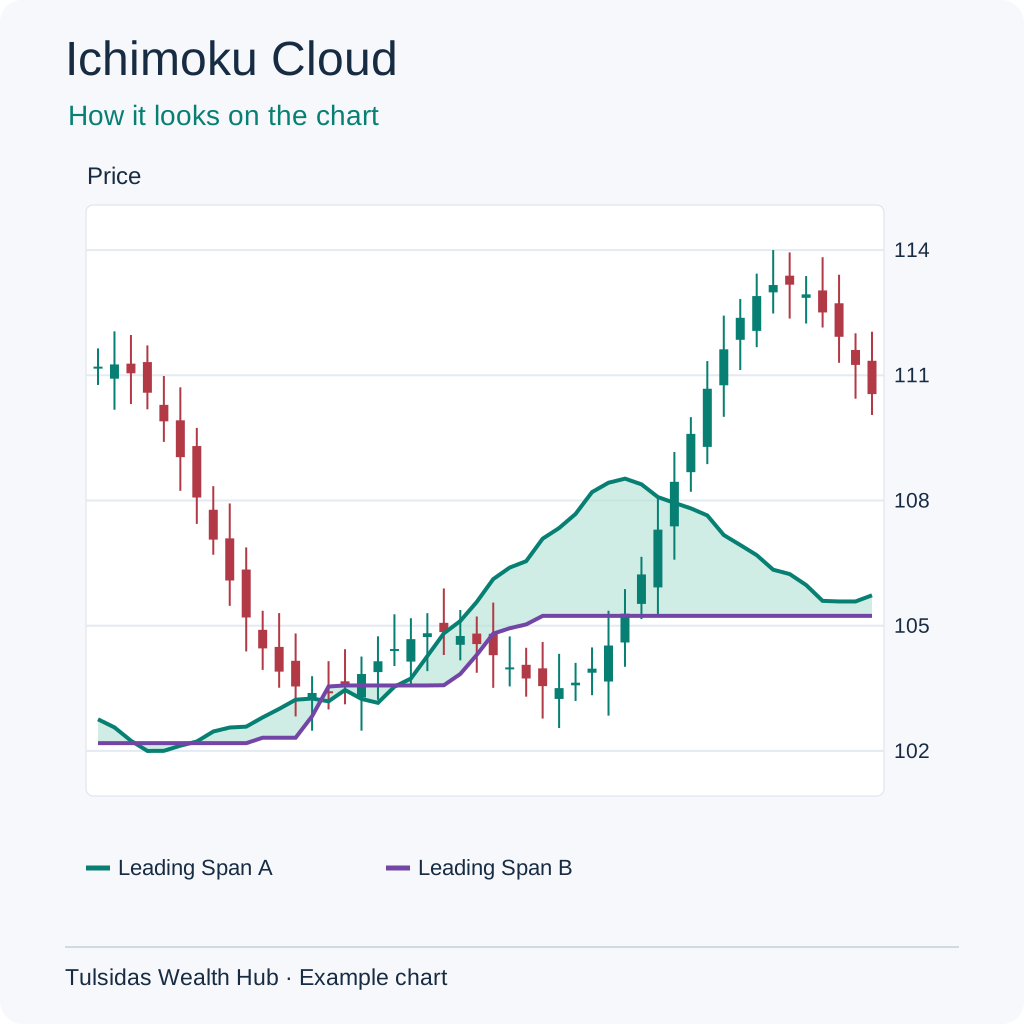
Ichimoku Cloud (Ichimoku Cloud (Ichimoku Kinko Hyo))
If a shop item traded between ₹90 and ₹110, the middle is ₹100. Ichimoku uses midpoints like that for different windows. Two lines form the coloured cloud. It is drawn ahead using past prices.
How to read it The cloud compares ranges over different windows. Price 105 above a cloud spanning 98–102 sits above the cloud. A thin or flat cloud can be crossed repeatedly.
How to add it to the chart In ƒx / Indicators, search for Ichimoku Cloud and select it. Example setting — 9 / 26 / 52.
See how the chart looks after adding the indicator.
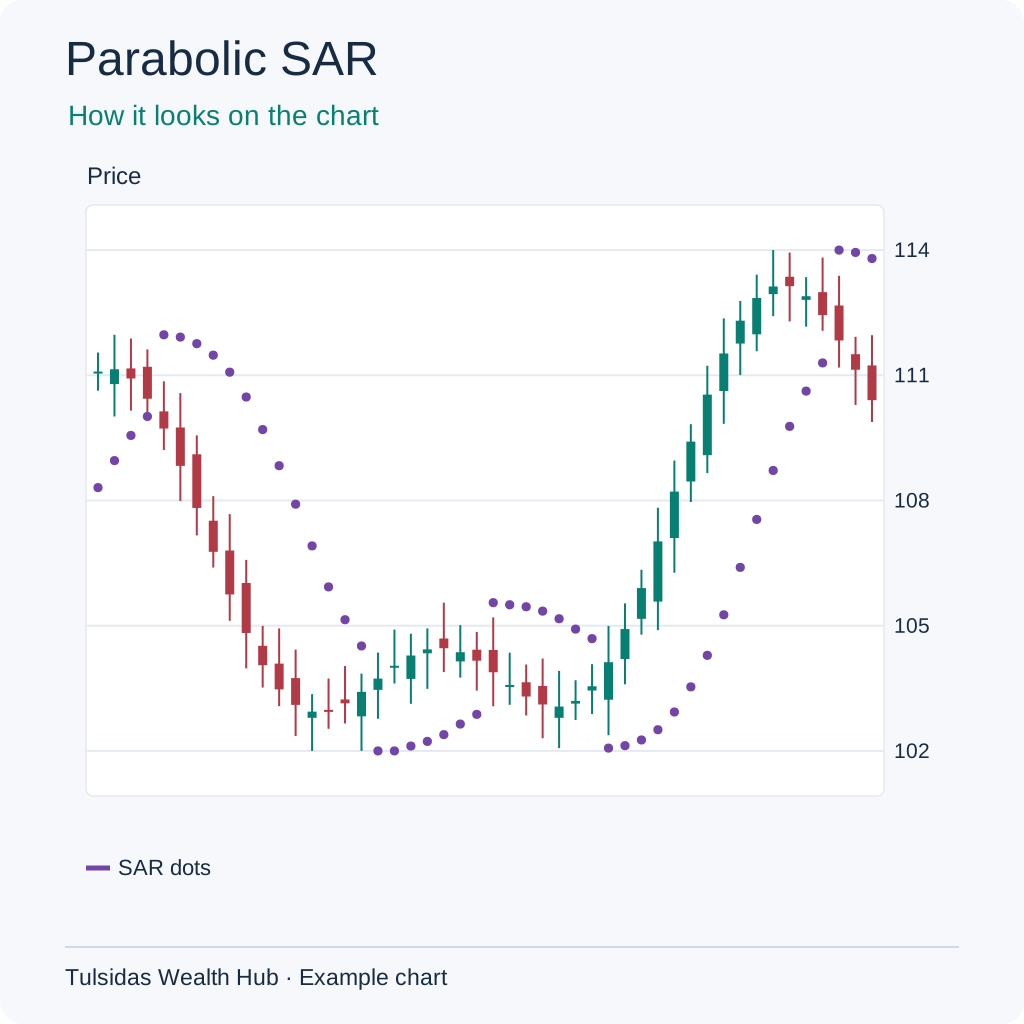
Parabolic SAR (Parabolic Stop and Reverse)
Picture someone marking the steps behind you as you climb a staircase. SAR dots follow price like those marks. As the price keeps setting new highs in an uptrend, the dots can catch up faster.
How to read it Plots trailing dots that switch sides as the price crosses the calculated level. Dots below price represent the rising state. A range can cause repeated reversals.
How to add it to the chart In ƒx / Indicators, search for Parabolic SAR and select it. Example setting — 0.02 step / 0.20 max.
See how the chart looks after adding the indicator.