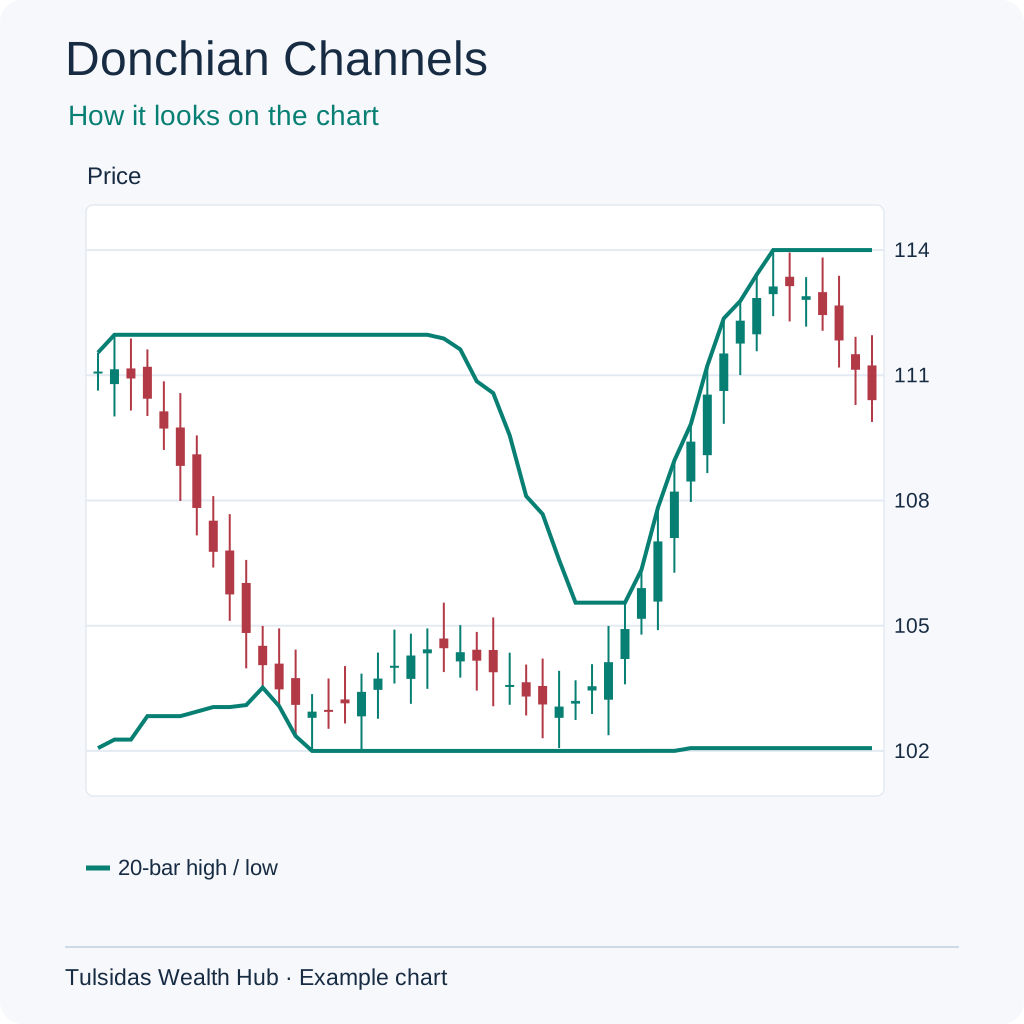
ATR (Average True Range)
If three journeys to work take 20, 30 and 40 minutes, the average is 30 minutes. ATR similarly averages how far price moves, including gaps. If yesterday closed at ₹100 and today traded from ₹105 to ₹110, today’s own range is ₹5 but the gap from yesterday’s close to the high is ₹10. The larger distance is used. A higher ATR shows bigger swings without telling you their direction.
How to read it Averages true range, including gaps from the previous close. ATR rising from ₹2 to ₹4 shows larger typical swings. It gives no up or down direction.
How to add it to the chart In ƒx / Indicators, search for ATR and select it. Example setting — 14 bars.
See how the chart looks after adding the indicator.
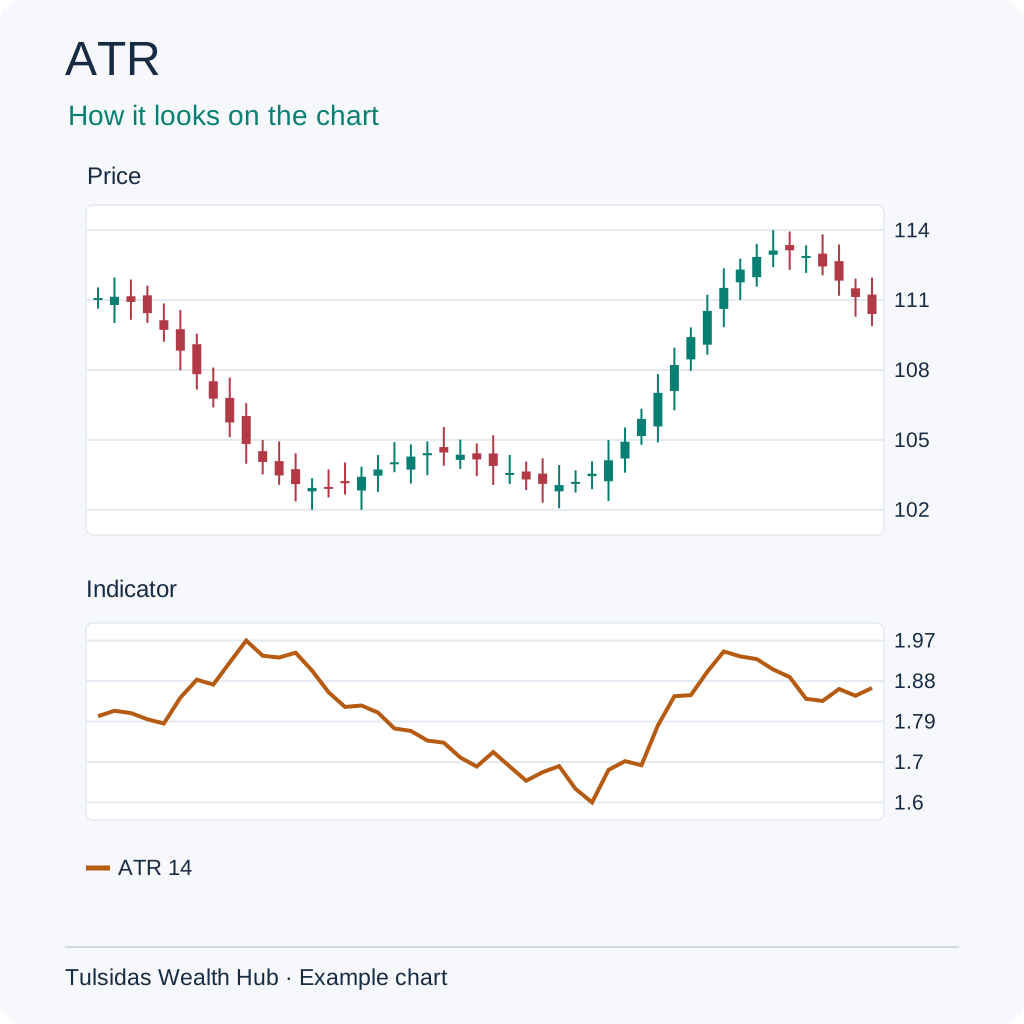
Bollinger Bands
Your shop usually sells around ₹1,000 a day. Around a festival, sales swing between ₹800 and ₹1,300. Bollinger Bands show how spread out prices are around their average. The middle line is the average and the outer lines move apart when prices vary more. Price can stay near an outer line in a strong trend.
How to read it Plots bands around an average. If the middle is 100 and standard deviation 3, bands are 94 and 106. Price touching a band can continue along it.
How to add it to the chart In ƒx / Indicators, search for Bollinger Bands and select it. Example setting — 20 bars · 2 standard deviations.
See how the chart looks after adding the indicator.
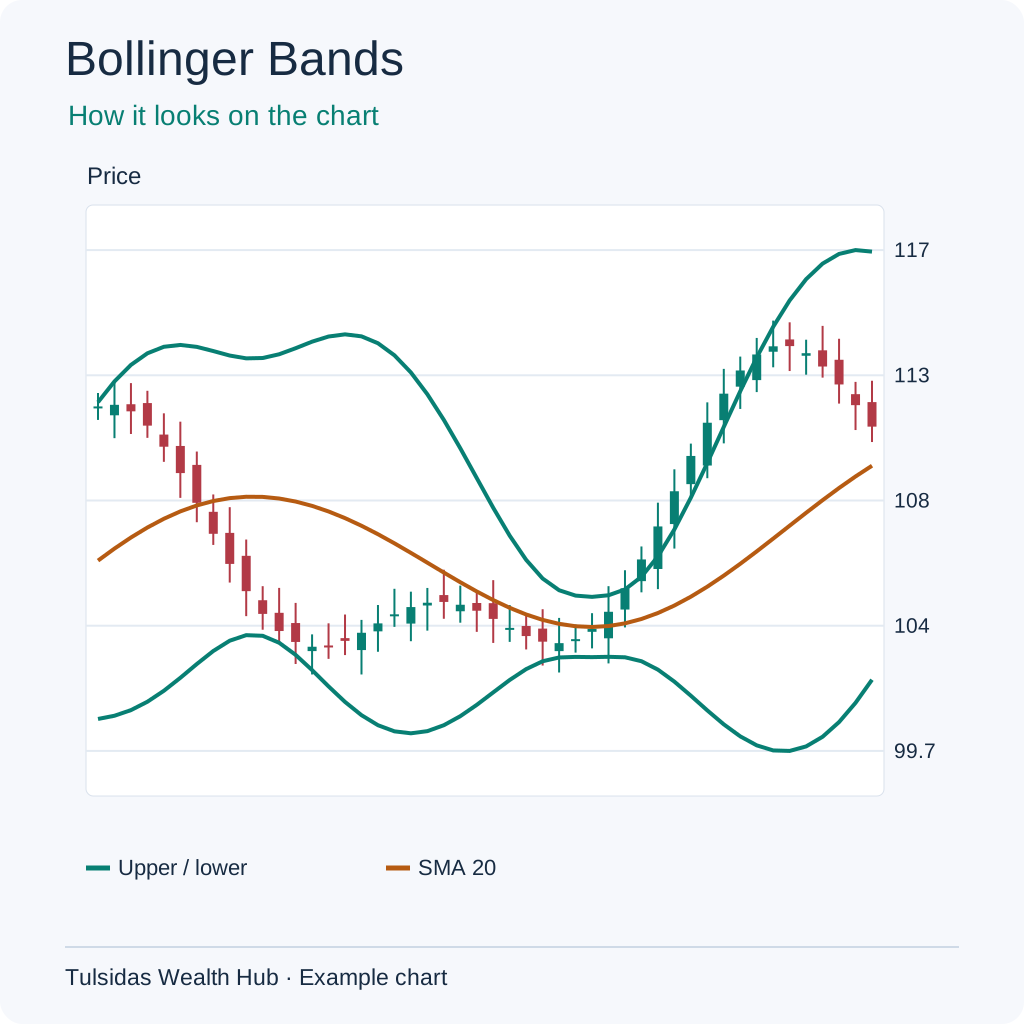
Keltner Channels
A journey takes about 30 minutes on average but can take 25 to 35 minutes depending on traffic. Keltner draws a band around the EMA and uses ATR for its width. If EMA is ₹100 and ATR ₹3, twice ATR puts the lines at ₹106 and ₹94.
How to read it Plots bands around an EMA using ATR. EMA 100 and ATR 3 give 94 and 106 with a 2× multiplier. Different platforms may use different ATR periods.
How to add it to the chart In ƒx / Indicators, search for Keltner Channels and select it. Example setting — 20 EMA · 2 ATR example.
See how the chart looks after adding the indicator.
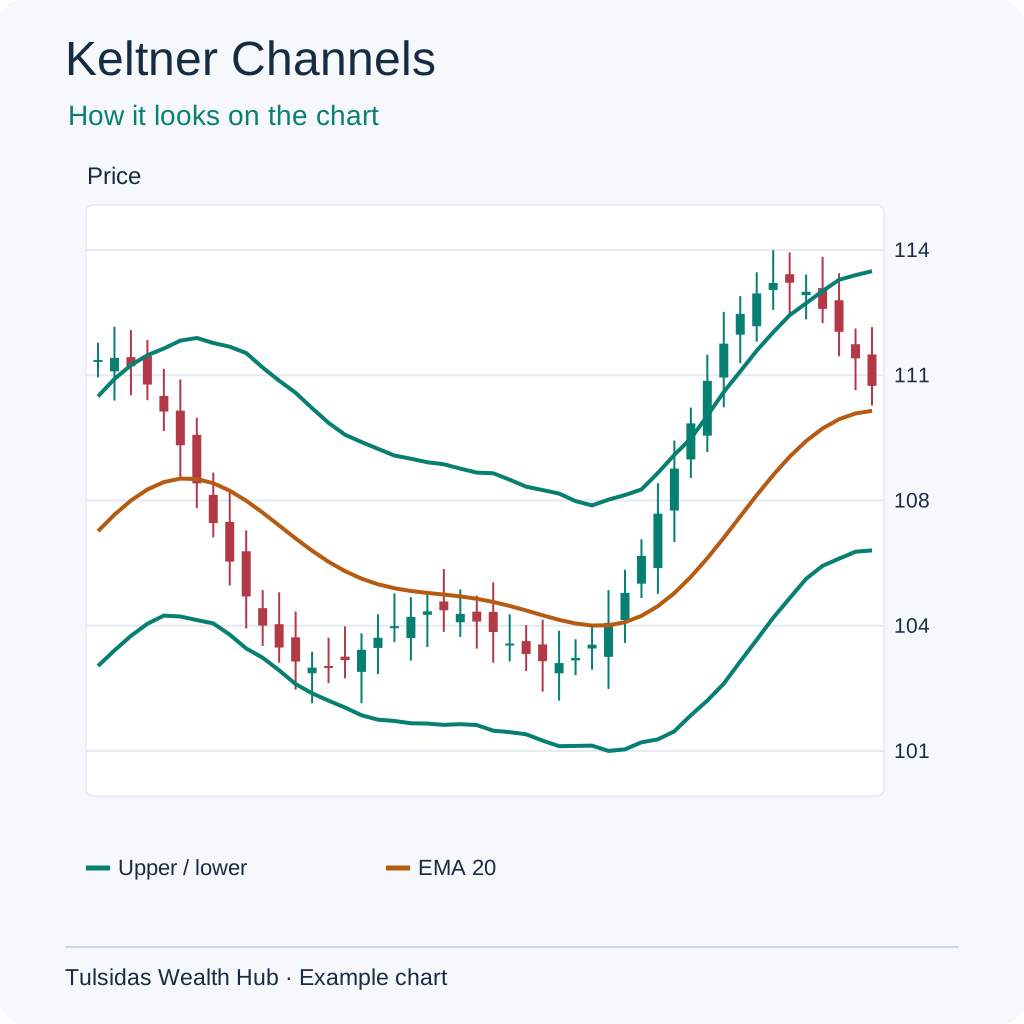
Donchian Channels
If your shop’s lowest and highest sales over 20 days were ₹90 and ₹110, those are the edges of its range. Donchian marks the recent highest high and lowest low on a chart. A price of ₹112 is above the prior range if it was ₹90–₹110.
How to read it Plots the highest high and lowest low in the lookback. If the previous 20-bar range is 90–110, a move to 112 exceeds that range. A break can fail.
How to add it to the chart In ƒx / Indicators, search for Donchian Channels and select it. Example setting — 20 bars.
See how the chart looks after adding the indicator.