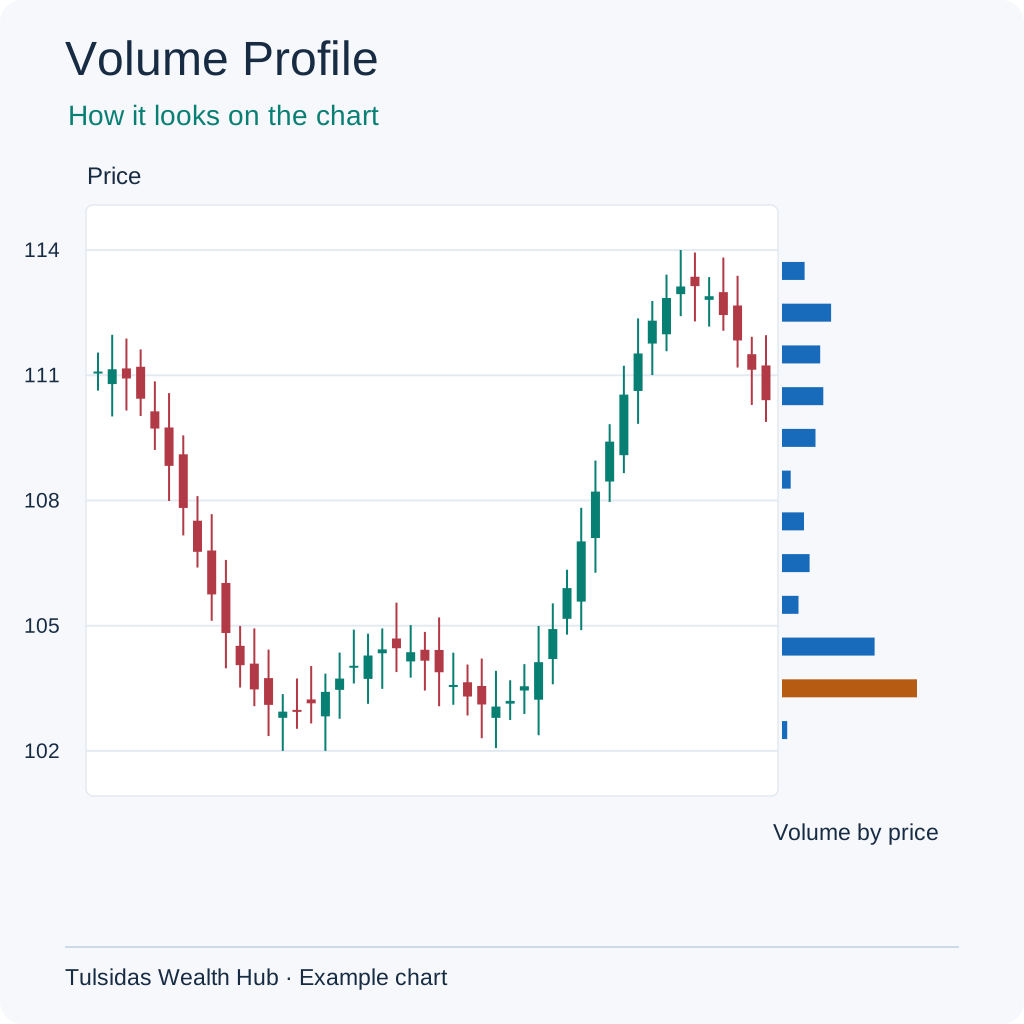
VWAP (Volume-Weighted Average Price)
You sell 10 items at ₹10 and 30 at ₹20. Total sales are ₹700 across 40 items, so the average price is ₹17.50. More items sold at ₹20, so the average is closer to ₹20. VWAP gives more weight to prices with more trading volume. Session VWAP starts at the start of the trading session.
How to read it Shows the volume-weighted average since the session began. Price at 105 against VWAP 102 is above that average. VWAP moves more slowly as volume accumulates.
How to add it to the chart In ƒx / Indicators, search for VWAP and select it. Example setting — Session anchor.
See how the chart looks after adding the indicator.
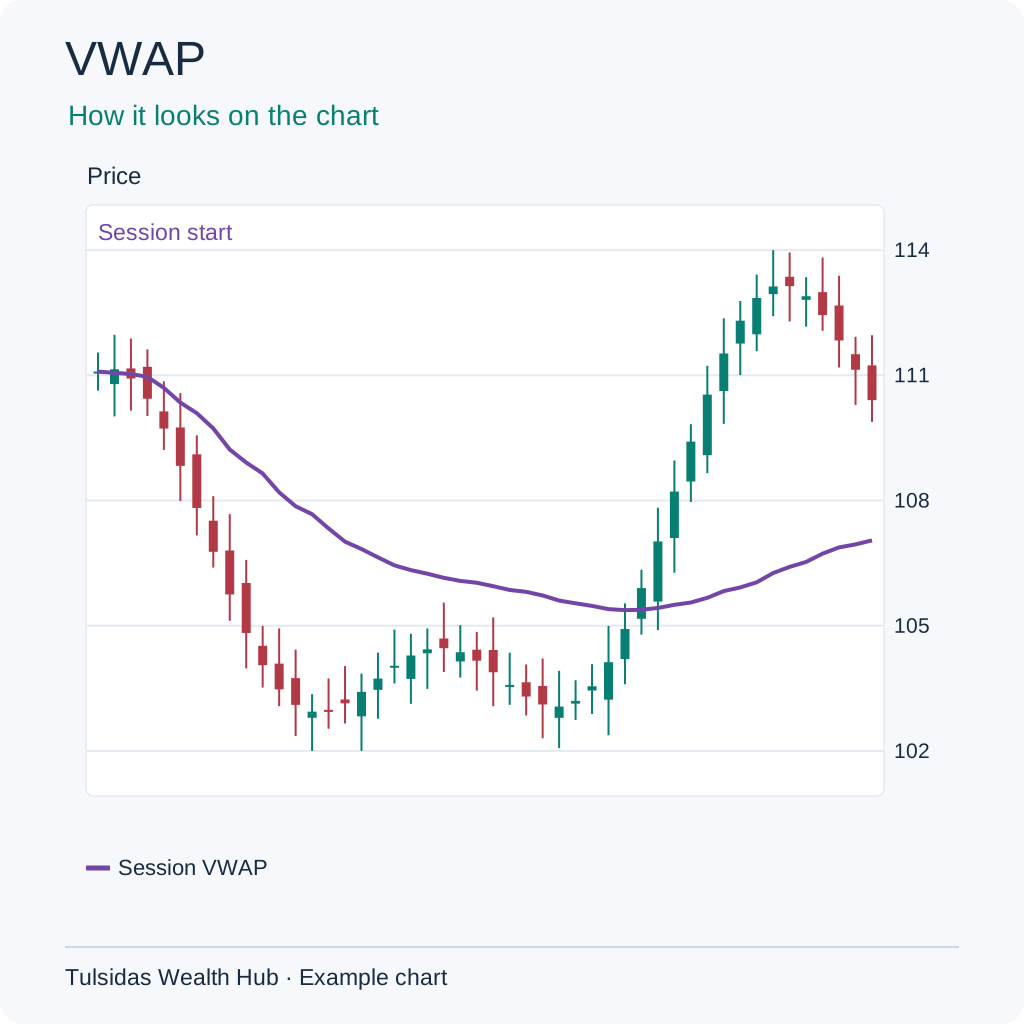
Anchored VWAP
If your shop starts an offer at noon, count sales from noon to find the average selling price since the offer began. Noon is your anchor. On a stock chart you could choose the first candle after a results announcement. Anchored VWAP weights prices by volume from that candle onward. A different starting candle can give a different average.
How to read it Uses the same weighting from a chosen bar. A result-day anchor with AVWAP 102 compares price with activity since that result. Changing the anchor changes the answer.
How to add it to the chart Open Drawing Tools, choose Anchored VWAP and tap the candle where the calculation should start.
See how the chart looks after adding the indicator.
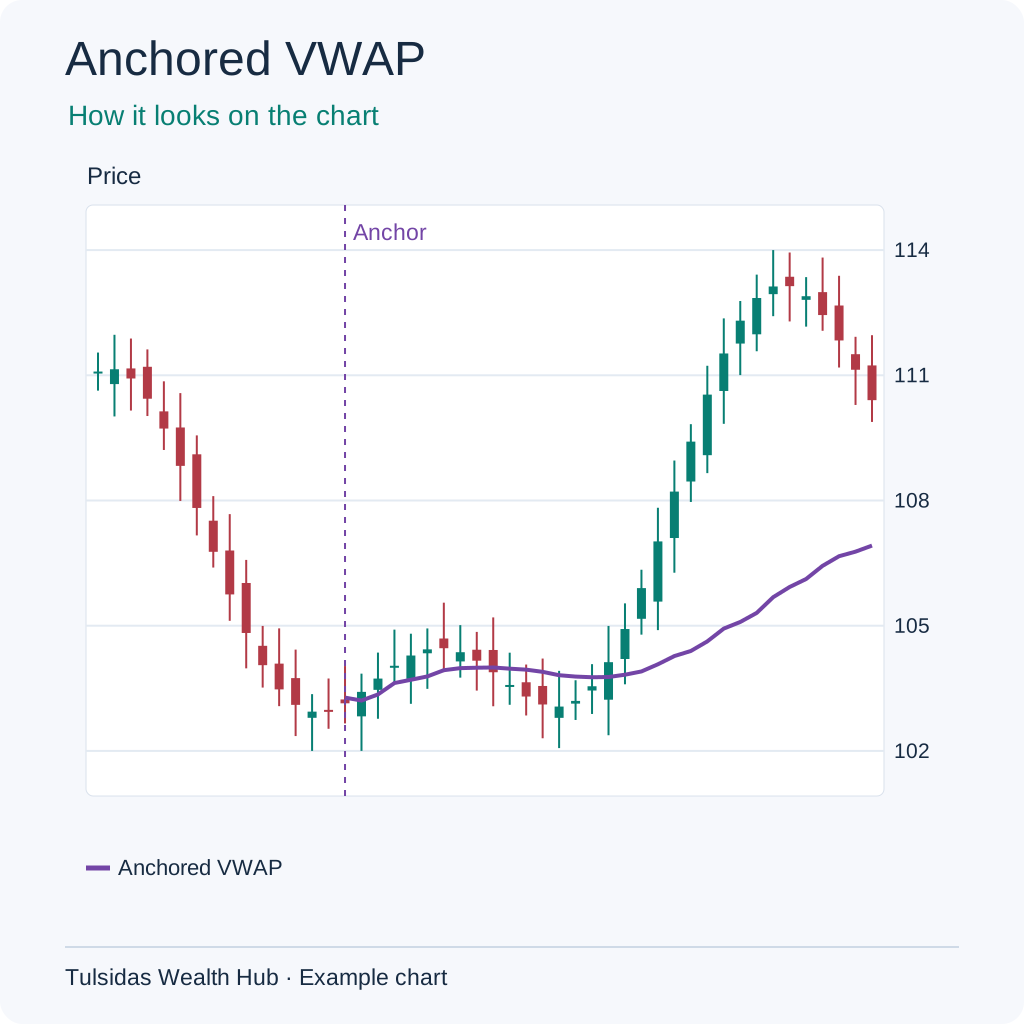
OBV (On-Balance Volume)
Imagine keeping a running tally of items sold at your shop. Add today’s items when the price closes higher than yesterday and subtract them when it closes lower. On a stock chart, an OBV of 1,000 plus 300 traded shares on a higher close becomes 1,300. A lower close with volume of 200 brings it to 1,100. An unchanged close leaves it alone.
How to read it Adds volume on higher closes and subtracts it on lower closes. If 800 units trade on an up close, OBV rises by 800. One large volume spike can dominate the line.
How to add it to the chart In ƒx / Indicators, search for OBV and select it. Example setting — Cumulative.
See how the chart looks after adding the indicator.
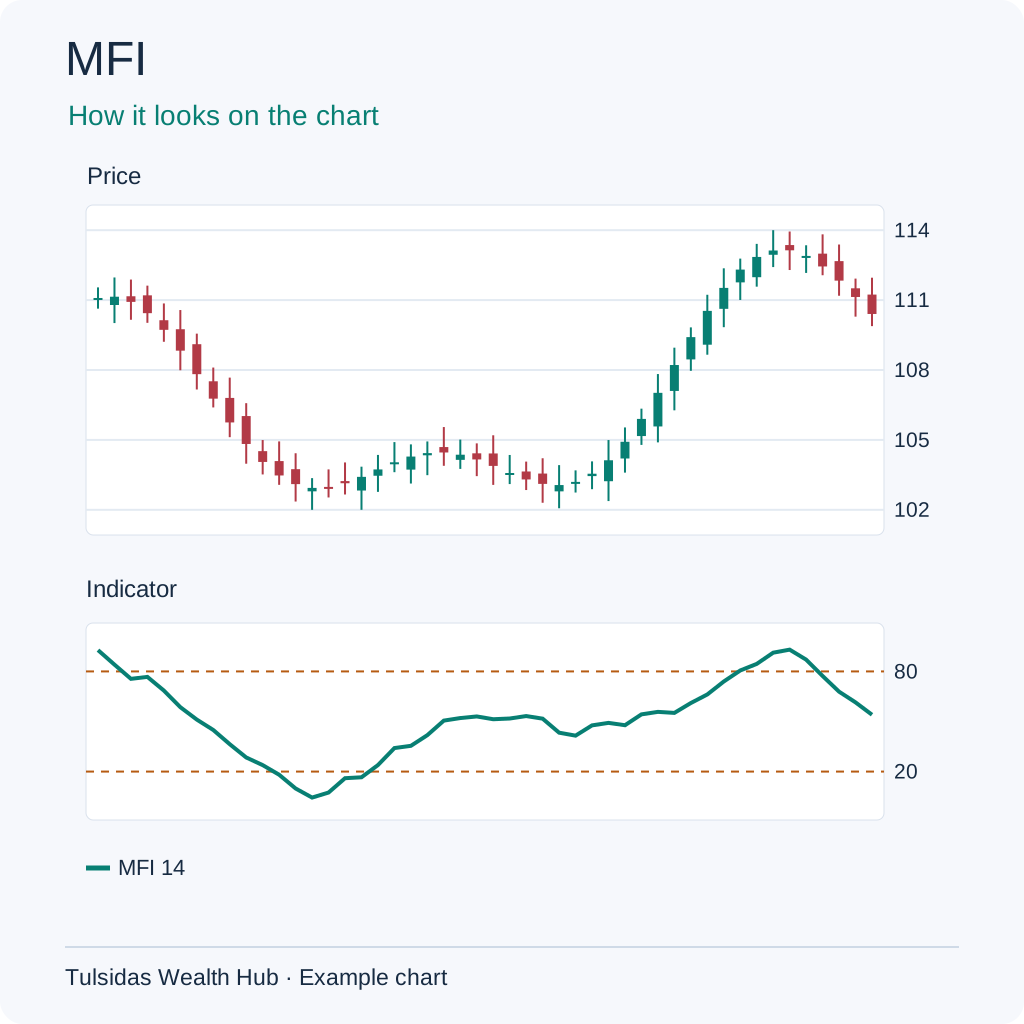
MFI (Money Flow Index)
On two days when the shop raised the price, it sold 10 items on one day and 100 on the other. More volume backed the price move on the second day. MFI uses both typical price and volume and compares up moves with down moves.
How to read it Combines price and volume into a 0–100 oscillator. MFI 85 shows strong positive money flow in its calculation. Thin or incomplete volume data can distort it.
How to add it to the chart In ƒx / Indicators, search for MFI and select it. Example setting — 14 bars · 20 / 80.
See how the chart looks after adding the indicator.
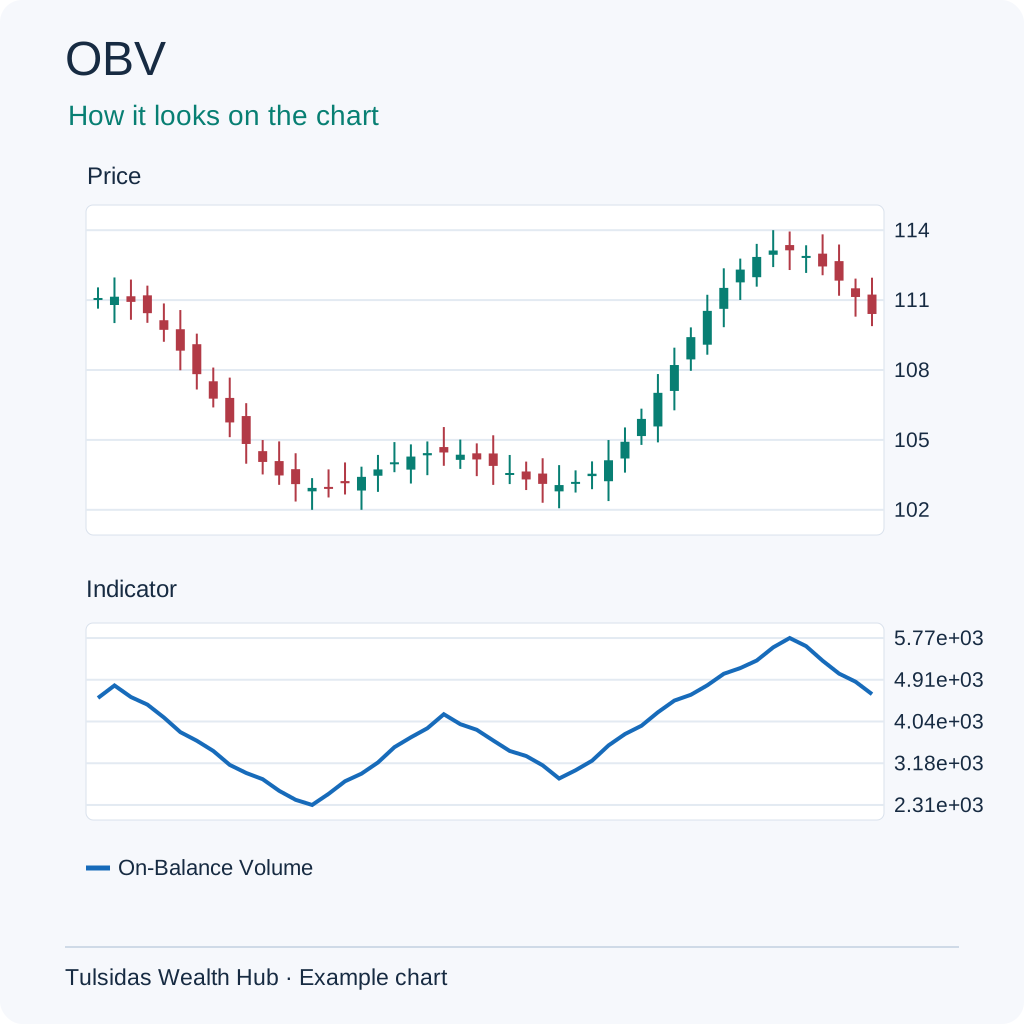
Volume Profile
If 10 items sell at ₹10, 30 at ₹20 and 5 at ₹30, ₹20 is where most items traded. Volume Profile shows this across price ranges. The longest horizontal bar marks the range with the most volume, known as the point of control.
How to read it Groups traded volume by price. If the 100–101 row has the most volume, it is the point-of-control row. A different window or bin size can move it.
How to add it to the chart Find Volume Profile, or choose Fixed Range Volume Profile and mark the start and end of the range.
See how the chart looks after adding the indicator.