Understanding a company
1. How the business earns money
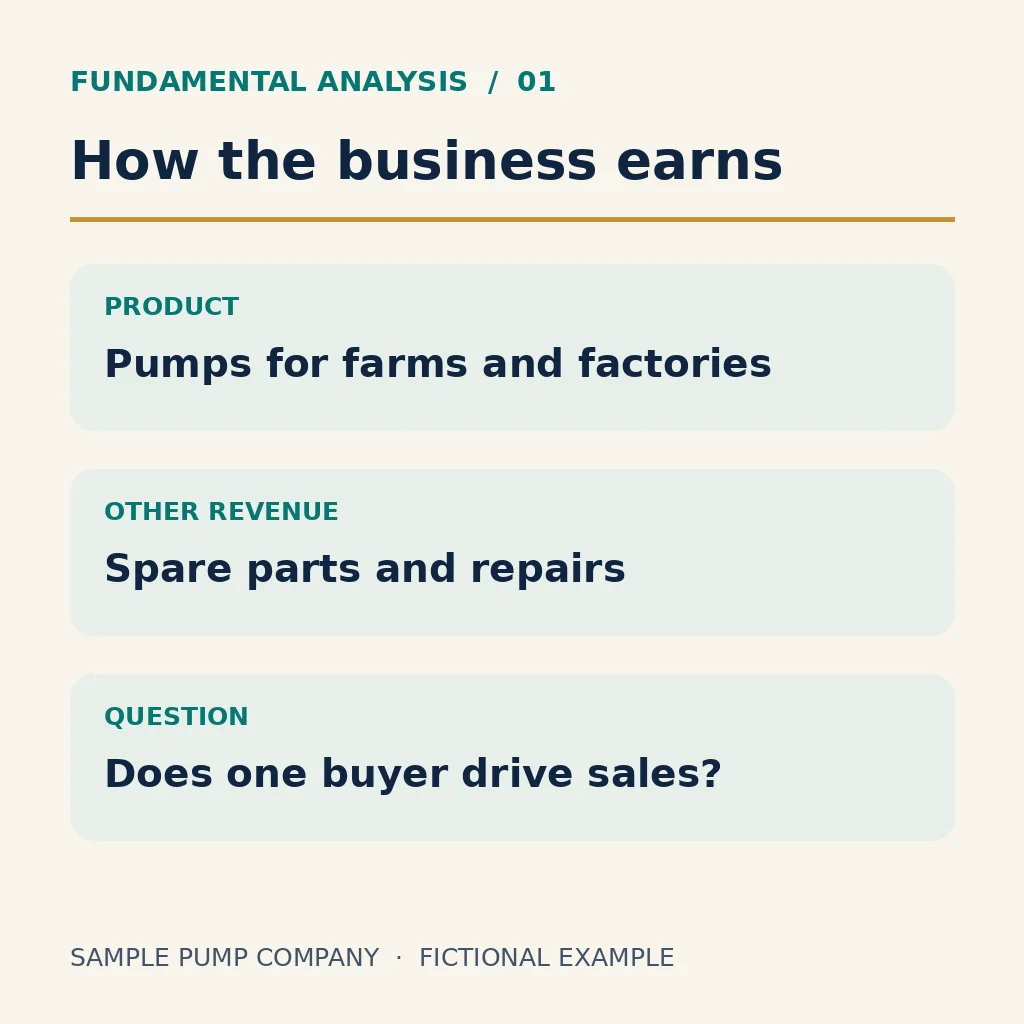
Start with what the company sells, who buys it and where revenue comes from. Our fictional Sample Pump Company sells pumps for farms and factories. It also earns from spare parts and repairs. If one customer accounts for a large share of sales, losing that customer can hurt the business.
2. Sales, profit and margin
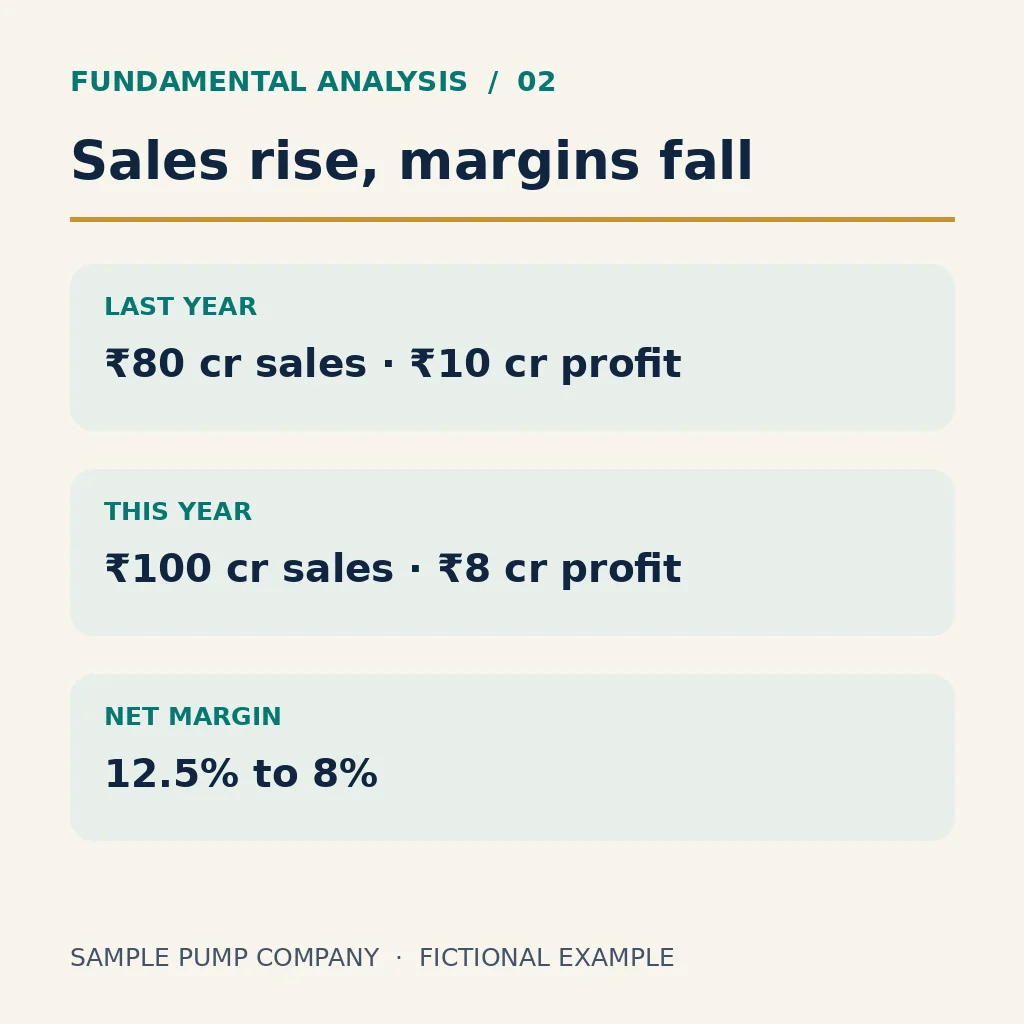
Last year, sales of ₹80 crore produced ₹10 crore of net profit. This year, sales rose to ₹100 crore but net profit fell to ₹8 crore. Net margin equals net profit divided by sales, so it fell from 12.5% to 8%. Check whether input costs rose, selling prices fell or other expenses increased.
3. Profit and loss statement (P&L)
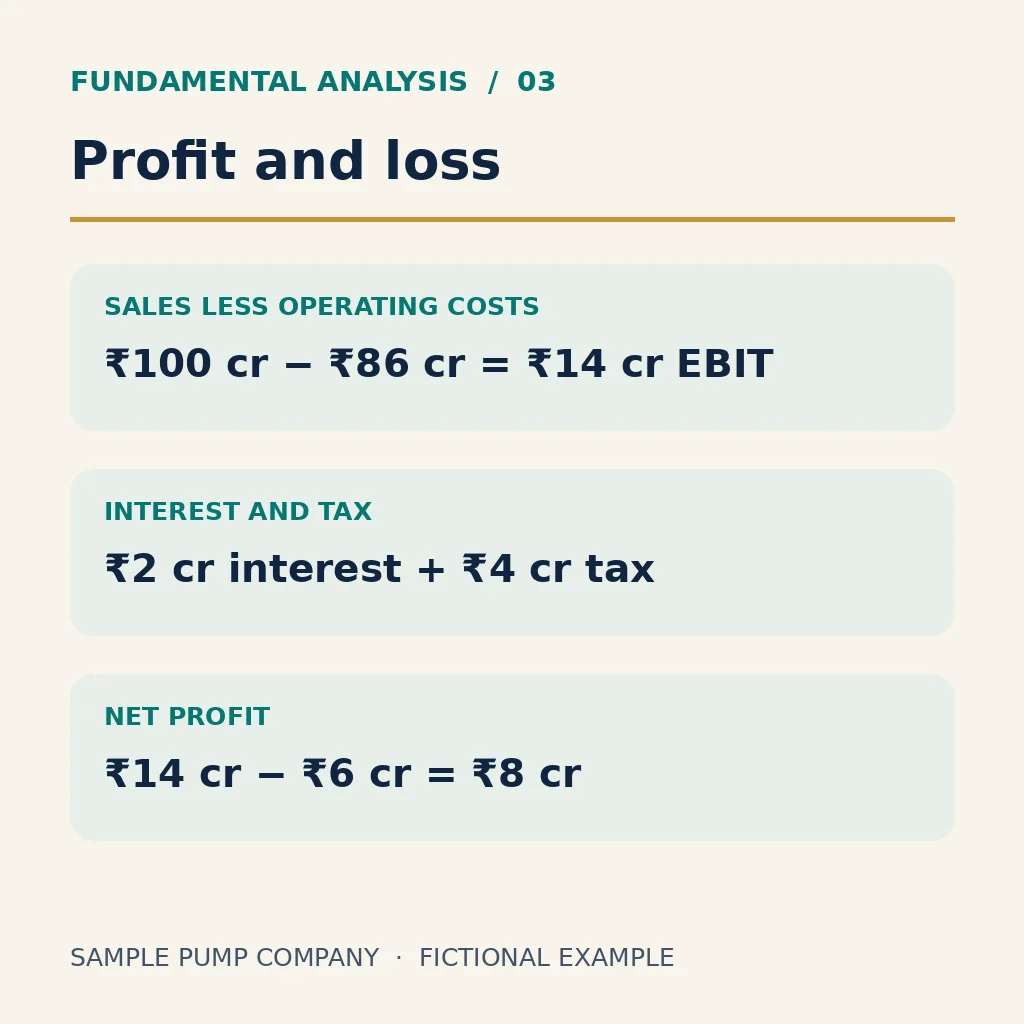
This statement records income, expenses and profit over a period. Sales of ₹100 crore less operating costs of ₹86 crore give ₹14 crore of earnings before interest and tax (EBIT). Subtract ₹2 crore of interest and ₹4 crore of tax to get ₹8 crore of net profit.
4. Balance sheet
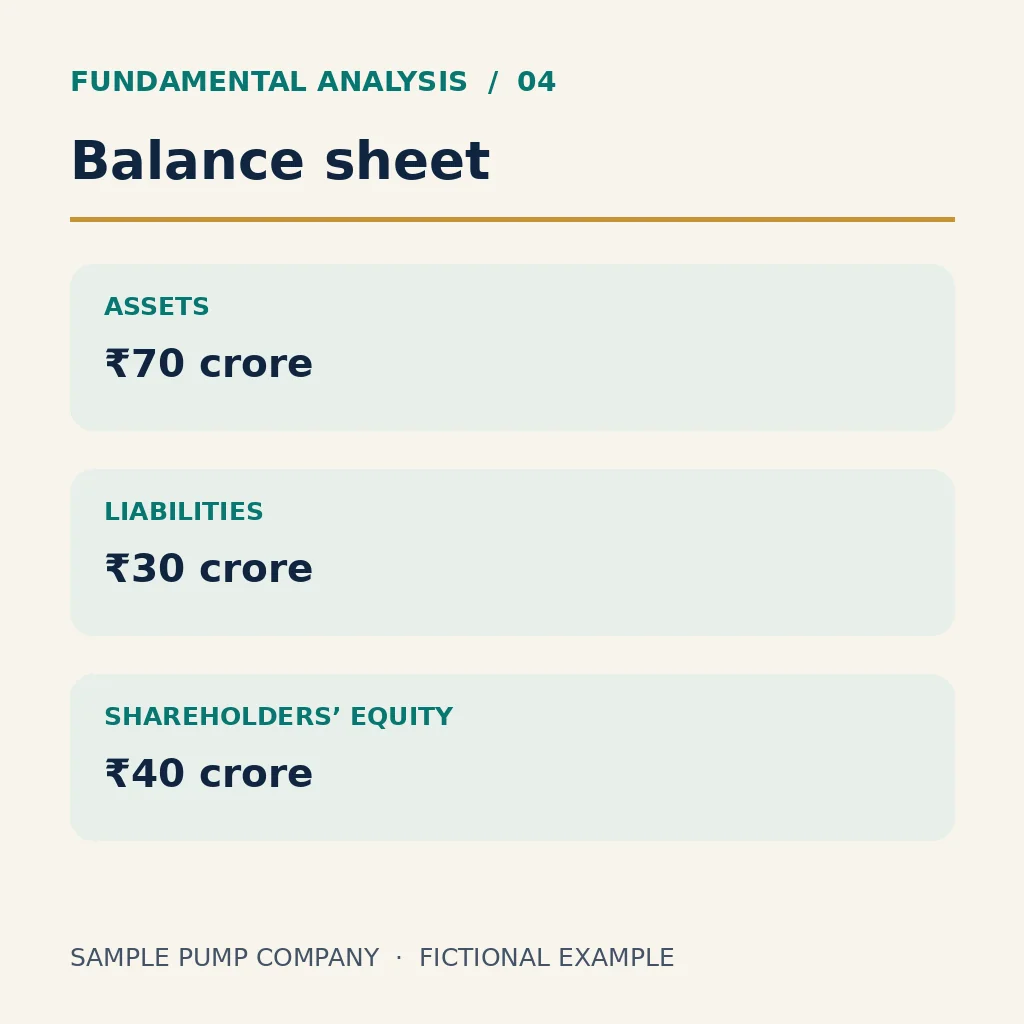
This is a snapshot on a specific date. At year-end, the company has ₹70 crore in assets, ₹30 crore in liabilities and ₹40 crore in shareholders’ equity. Liabilities include ₹20 crore of borrowings and ₹10 crore of other obligations. Check cash and payments due soon as well.
5. Cash flow
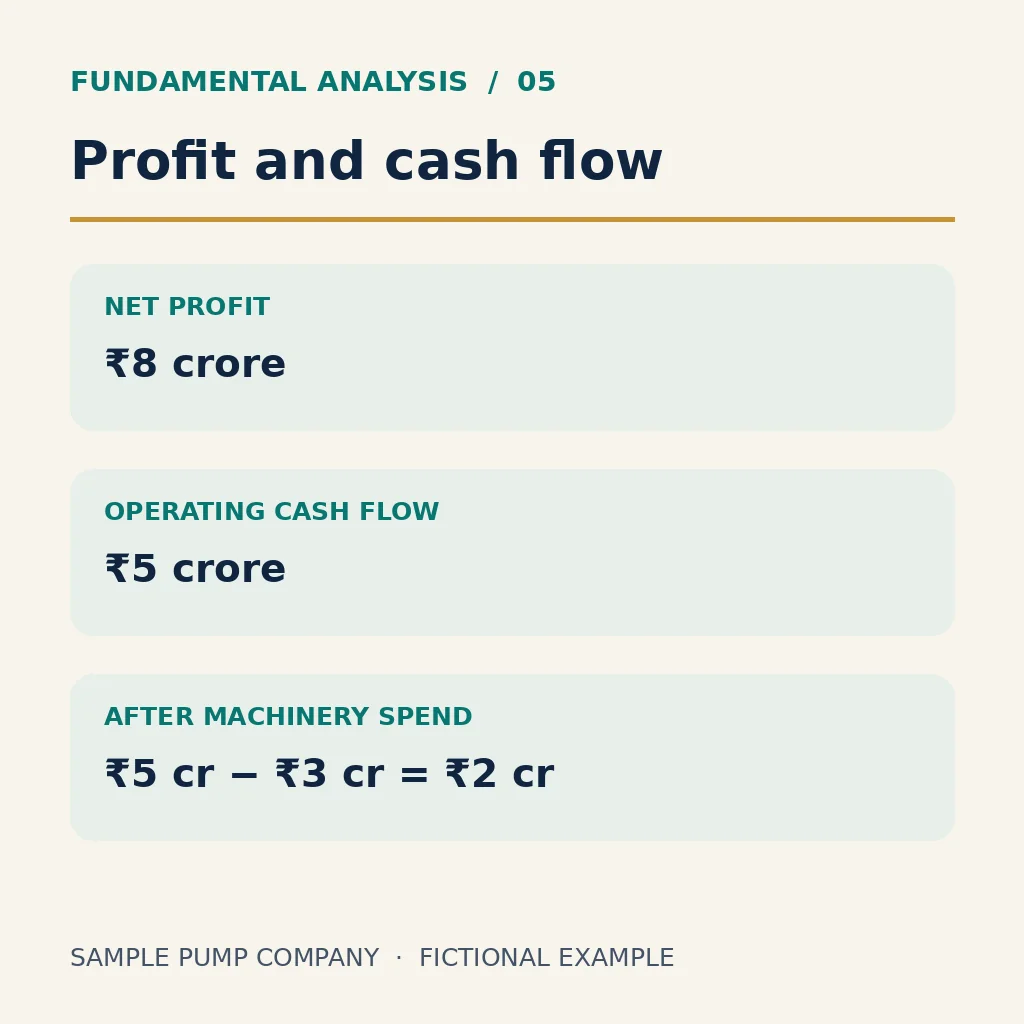
The company reports ₹8 crore of net profit but generates ₹5 crore of operating cash. A credit sale can count toward profit before the customer pays. After ₹3 crore of spending on machinery, simplified free cash flow in this example is ₹2 crore.
6. Debt and interest
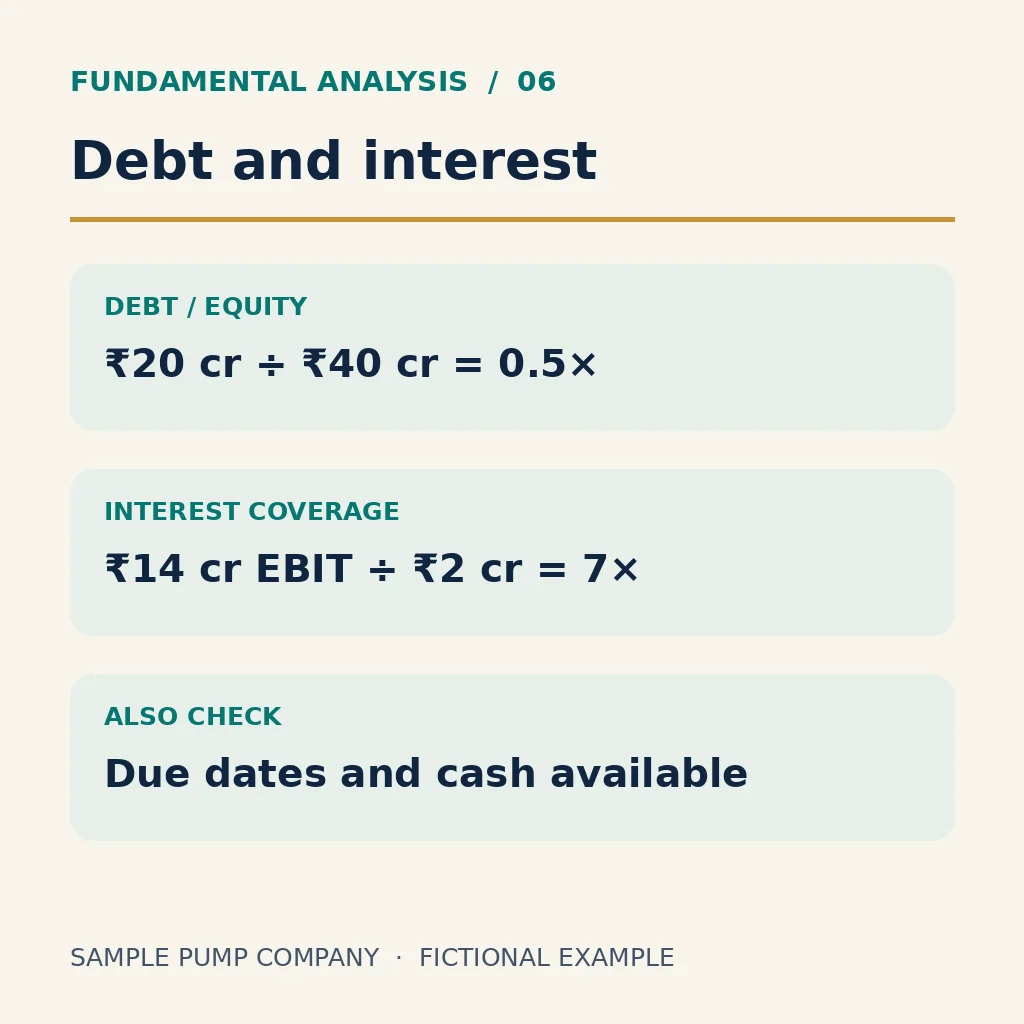
Year-end debt of ₹20 crore divided by equity of ₹40 crore gives debt-to-equity of 0.5×. EBIT of ₹14 crore divided by interest of ₹2 crore gives interest coverage of 7×. Also check when debt falls due and how much cash the company has available.
7. Earnings per share (EPS)
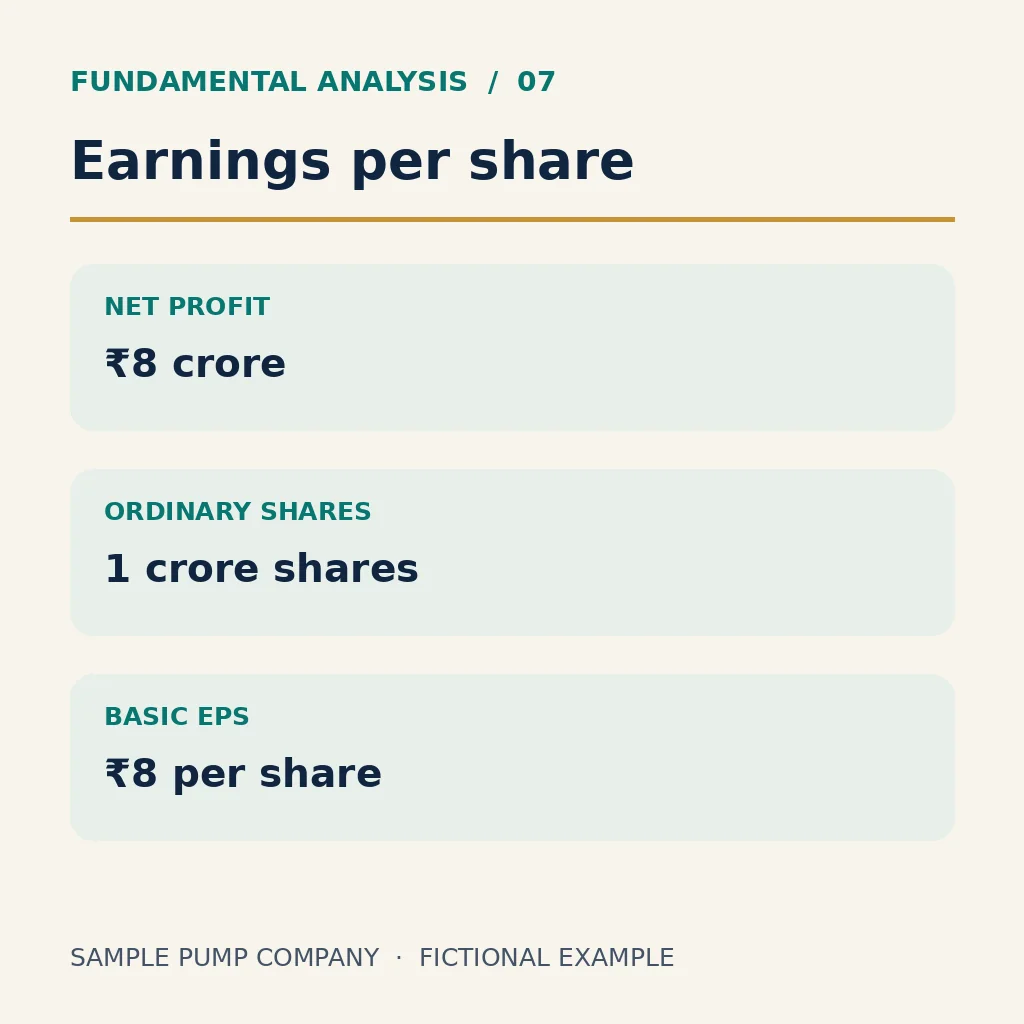
Assume all ₹8 crore of net profit belongs to ordinary shareholders and one crore ordinary shares were outstanding throughout the year. Basic EPS is ₹8. Actual reports use the weighted average number of shares for the period. Look separately at dividends to see what was paid out.
8. P/E and valuation
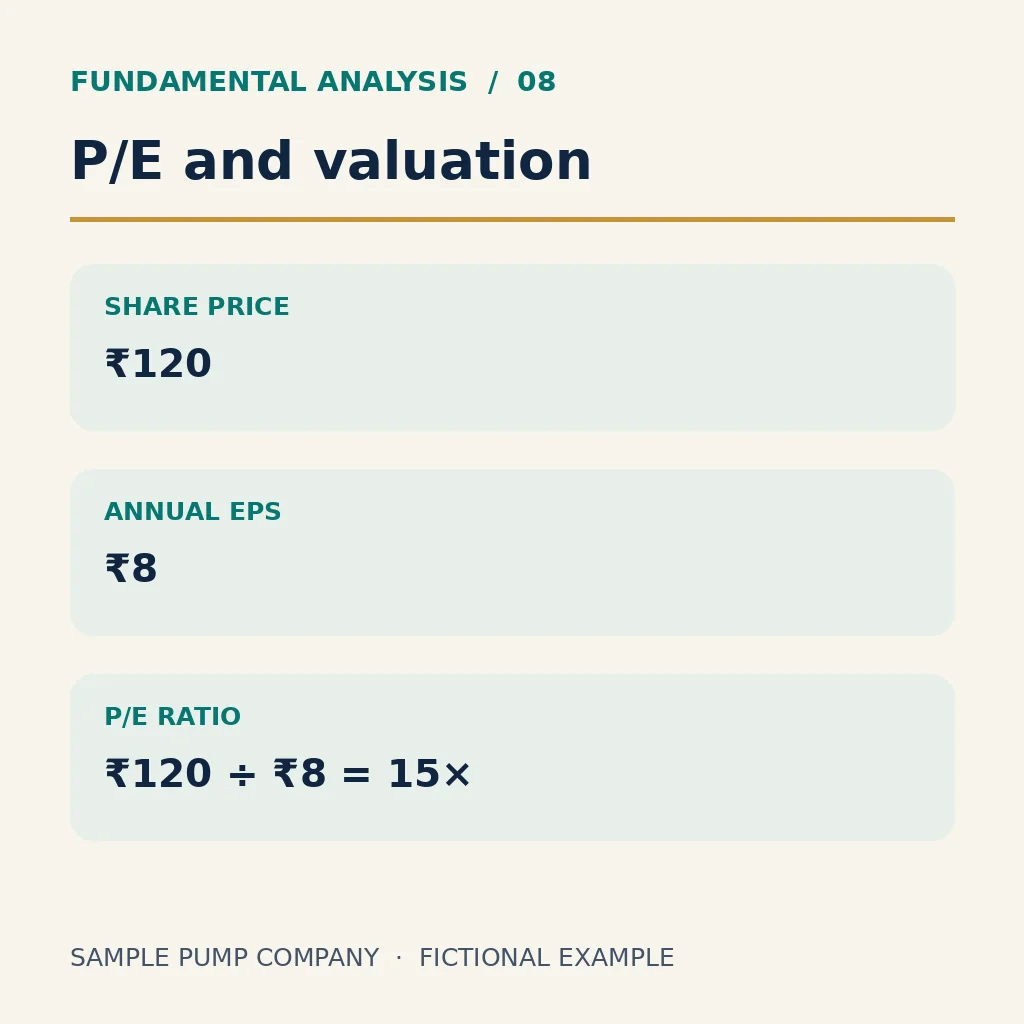
At a fictional share price of ₹120 and annual EPS of ₹8, the P/E is 15×. A lower P/E can reflect slower growth, higher risk or a one-off profit. Compare similar businesses over the same period. Conventional P/E comparisons are unhelpful when EPS is zero or negative.
9. ROE and ROCE
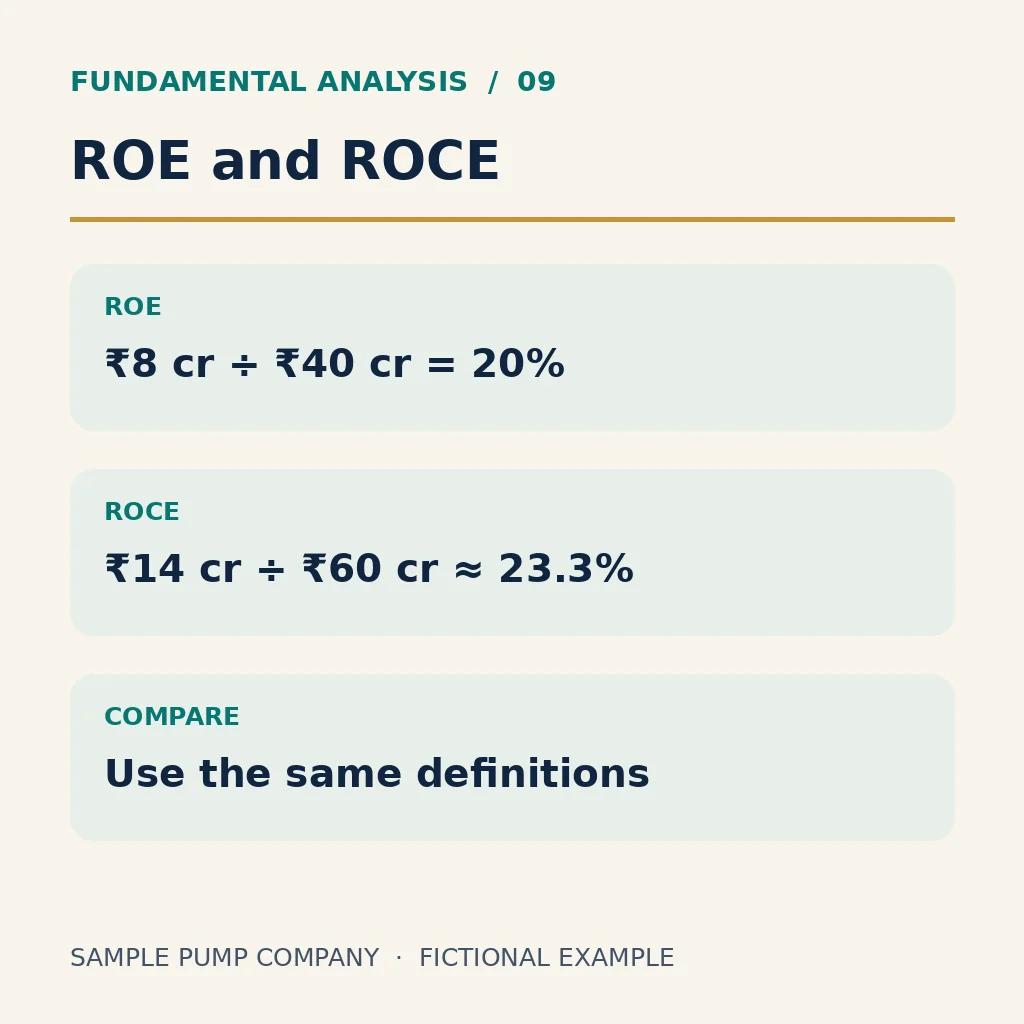
Assuming average equity of ₹40 crore, ROE is ₹8 ÷ ₹40 = 20%. Assuming average capital employed of ₹60 crore, ROCE in this example is EBIT of ₹14 ÷ ₹60 ≈ 23.3%. ROCE definitions can vary, so use a consistent definition across comparisons.
10. Management, competition and risks
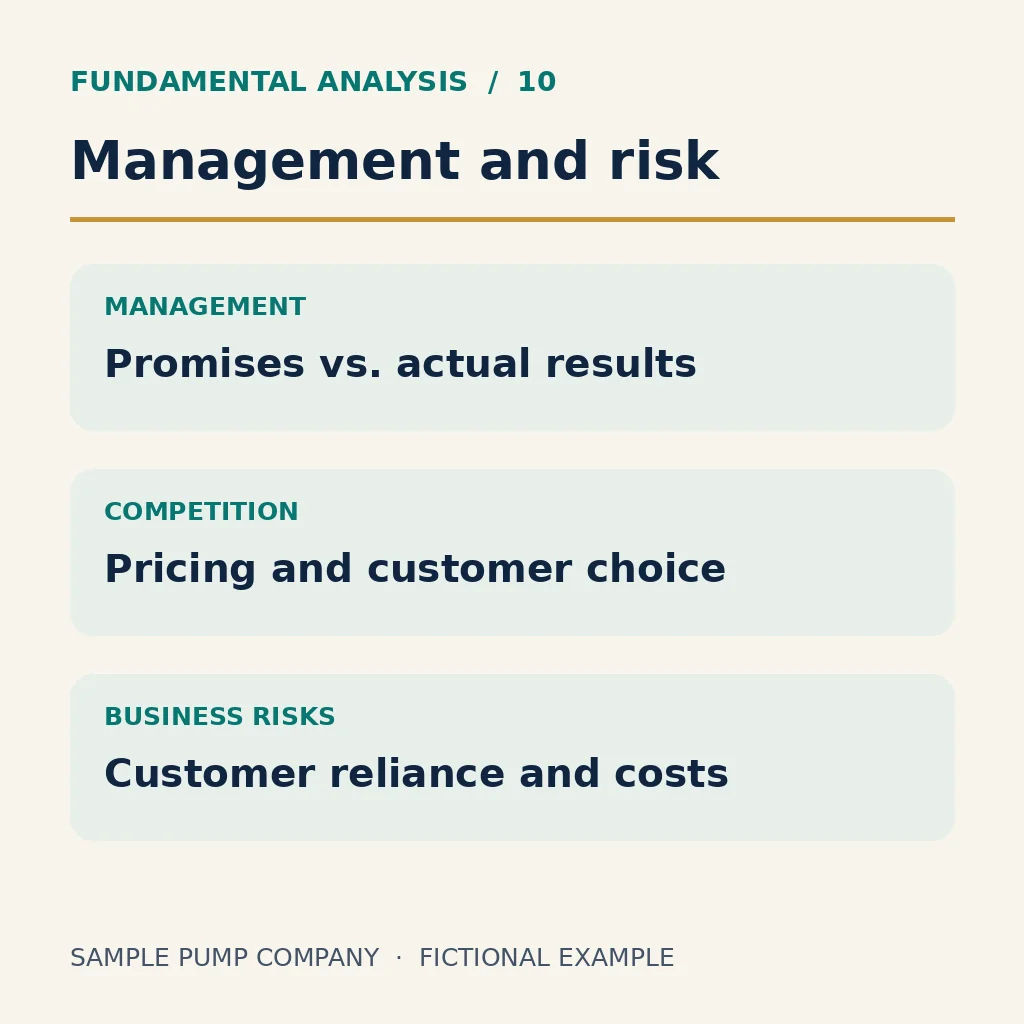
If the pump company is building a new plant, check what management says about the cost, schedule and funding. Compare previous commitments with actual results. Use annual reports and exchange filings to check dependence on large customers, input costs and competitors’ pricing.