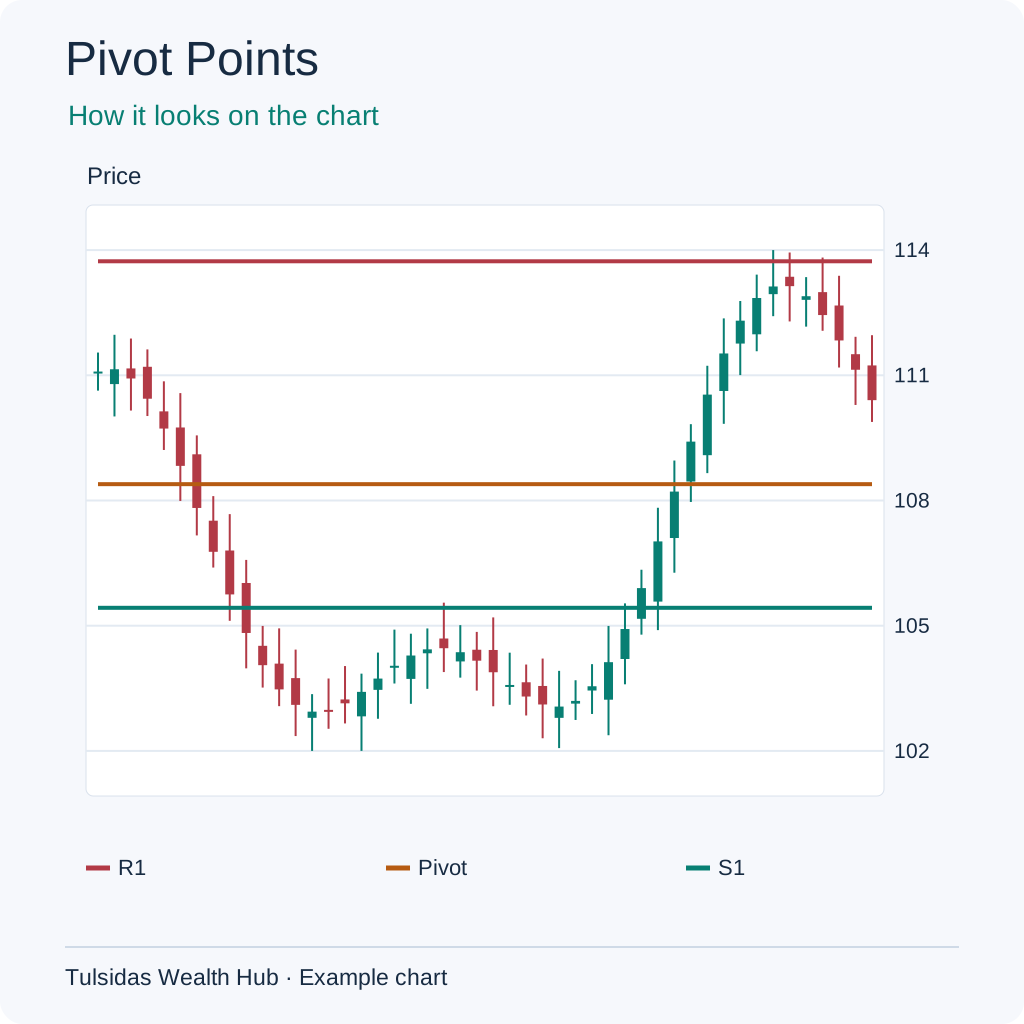
Pivot Points (Classic Pivot Points)
If yesterday’s high was ₹110, low ₹90 and close ₹100, their average is ₹100. That is today’s central Classic Pivot. The other lines mark potential support and resistance around it.
How to read it The central pivot is the average of the prior period’s high, low and close. With 110, 90 and 100 it is 100. Other pivot methods use different formulas.
How to add it to the chart In ƒx / Indicators, search for Pivot Points and select it. Example setting — Daily · Classic.
See how the chart looks after adding the indicator.
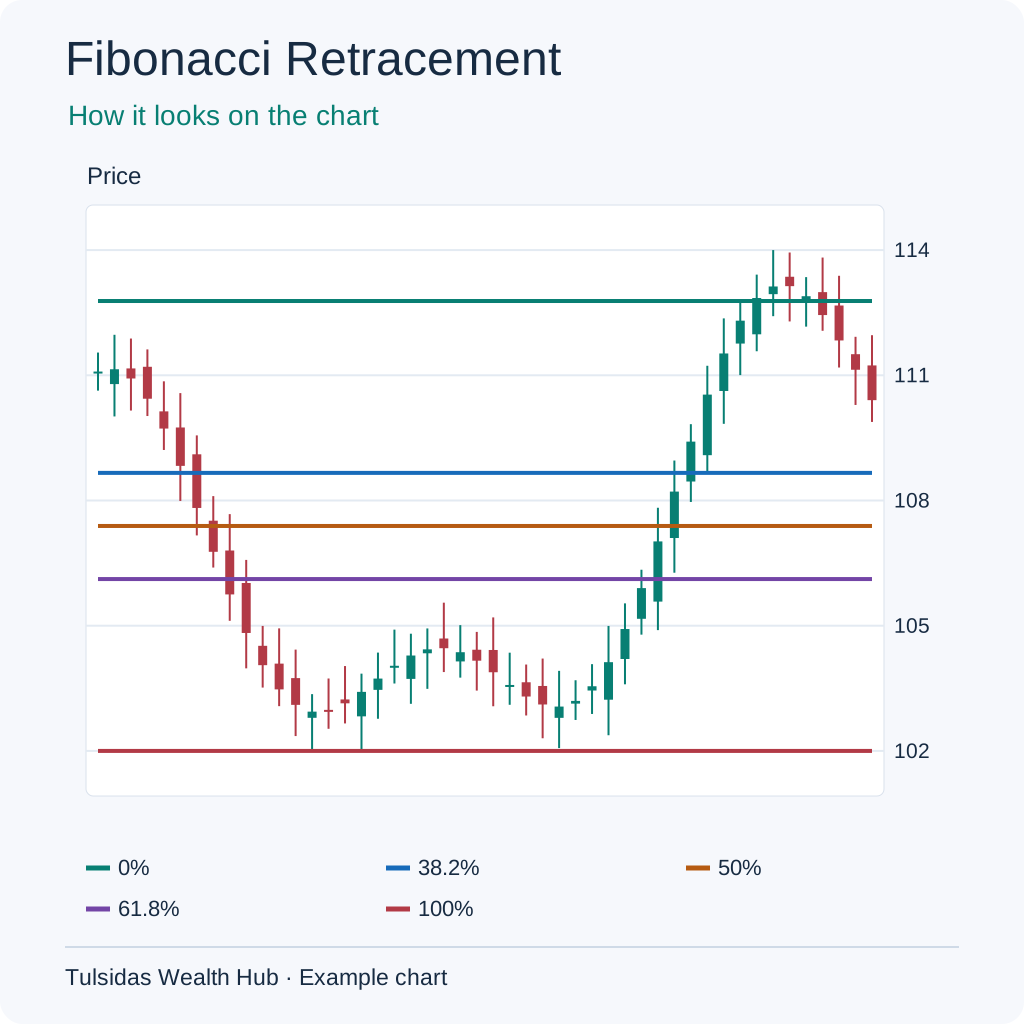
Fibonacci Retracement
A price rises from ₹100 to ₹120, then returns to ₹110. It has given back ₹10 of its ₹20 rise, or 50%. The tool marks levels like 38.2%, 50% and 61.8% between the points you choose.
How to read it Marks pullback levels between two swings. After a rise from 100 to 120, a 50% pullback reaches 110. The result depends on the chosen swings, and price can pass straight through.
How to add it to the chart Open Drawing Tools and choose Fib Retracement. To measure a rise, mark the swing low first and then the swing high.
See how the chart looks after adding the indicator.